
Fig. 6
- ID
- ZDB-IMAGE-240314-13
- Publication
- Chiang et al., 2023 - The Role of MAPRE2 and Microtubules in Maintaining Normal Ventricular Conduction
- All Figures
- Figures for Chiang et al., 2023
|
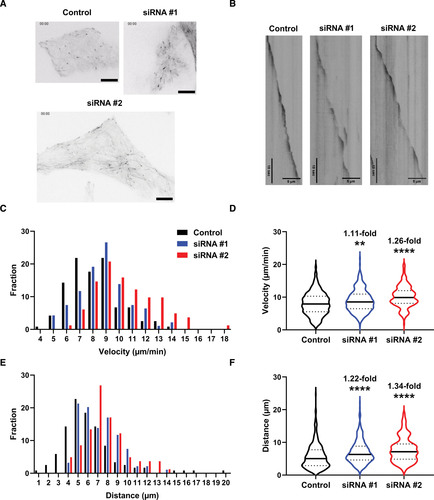
Fig. 6 mapre2 loss of function leads to changes in microtubule dynamics. A, Representative still images of microtubule plus-end-tracking experiments in induced pluripotent stem cell derived cardiomyocytes (iPSC-CMs) with MAPRE2 knockdown (KD) using 2 different siRNA vs control siRNA. Scale bars, 10 µm. Please refer to the Supplemental Material for representative videos (Video S1, control; Video S2, siRNA 1; and Video S3, siRNA 2). B, Representative kymographs obtained from the live-cell imaging, which were used for measurement of microtubule parameters. Vertical scale bars, 10 s; horizontal scale bars, 5 µm. Compared with control, MAPRE2 knockdown with siRNAs 1 and 2 resulted in 1.11-fold (P=0.0079) and 1.26-fold (P<0.0001) increases in microtubule growth velocity ( C and D) and in 1.22-fold (P<0.0001) and 1.34-fold (P<0.0001) increases in microtubule growth distance ( E and F), respectively. Dunn multiple comparison tests were used following significant Kruskal-Wallis tests (P<0.0001 for both D and F). Data extracted from 368 control microtubules, 314 siRNA 1 microtubules, and 194 siRNA 2 microtubules, in 5 sets of cells. Representative videos and images were chosen based on closeness to group mean and quality.