
Image
|
Figure Caption
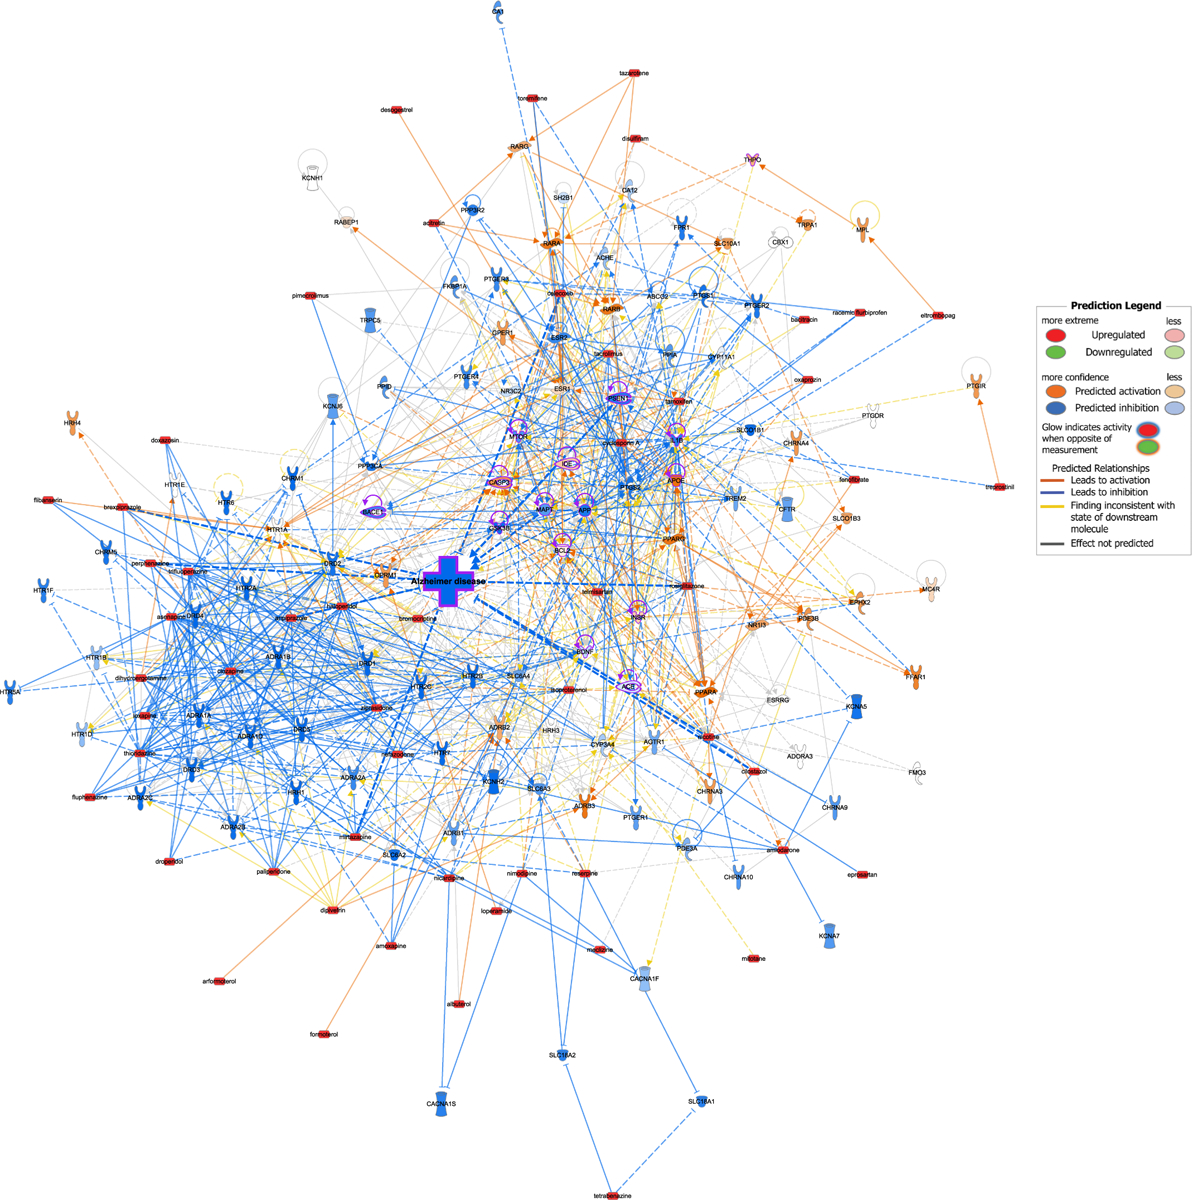
Fig. 6. IPA analysis showing the predicted effect of CsA-like compounds on Alzheimer’s disease
Orange lines and nodes indicate predicted activation, blue lines and nodes indicate predicted inhibition, and yellow lines indicate inconsistent findings. Red nodes indicate activation through custom input using the Molecule Activity Predictor (MAP). Purple outlines indicate AD-related nodes.
Acknowledgments
This image is the copyrighted work of the attributed author or publisher, and
ZFIN has permission only to display this image to its users.
Additional permissions should be obtained from the applicable author or publisher of the image.
Full text @ Biomed. Pharmacother.