
Image
|
Figure Caption
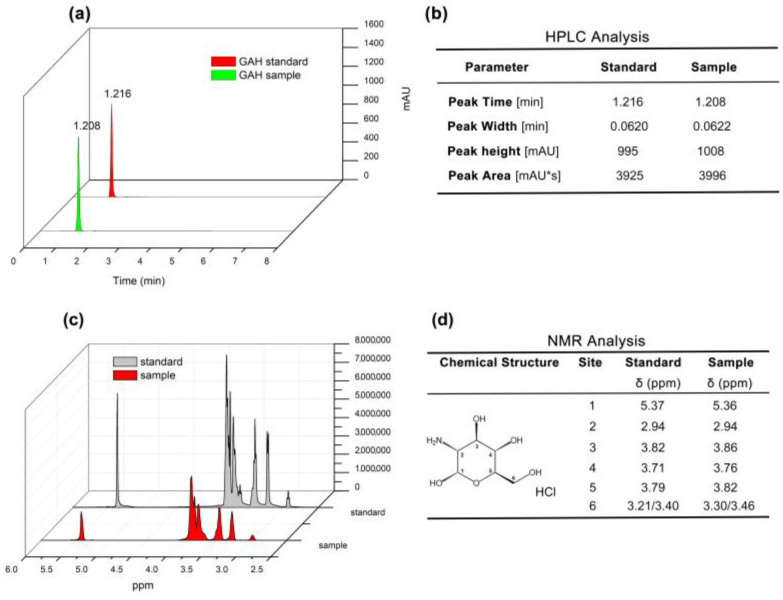
Figure 1 HPLC and 1HNMR data of GAH. (a) Peak graph of standard and Agaricus bisporus-derived (sample) GAH. (b) Related parameter of (a). (c) Proton NMR spectra. (d) Chemical shifts of the 1H of standard and sample GAH.
Acknowledgments
This image is the copyrighted work of the attributed author or publisher, and
ZFIN has permission only to display this image to its users.
Additional permissions should be obtained from the applicable author or publisher of the image.
Full text @ Life (Basel)