
Image
|
Figure Caption
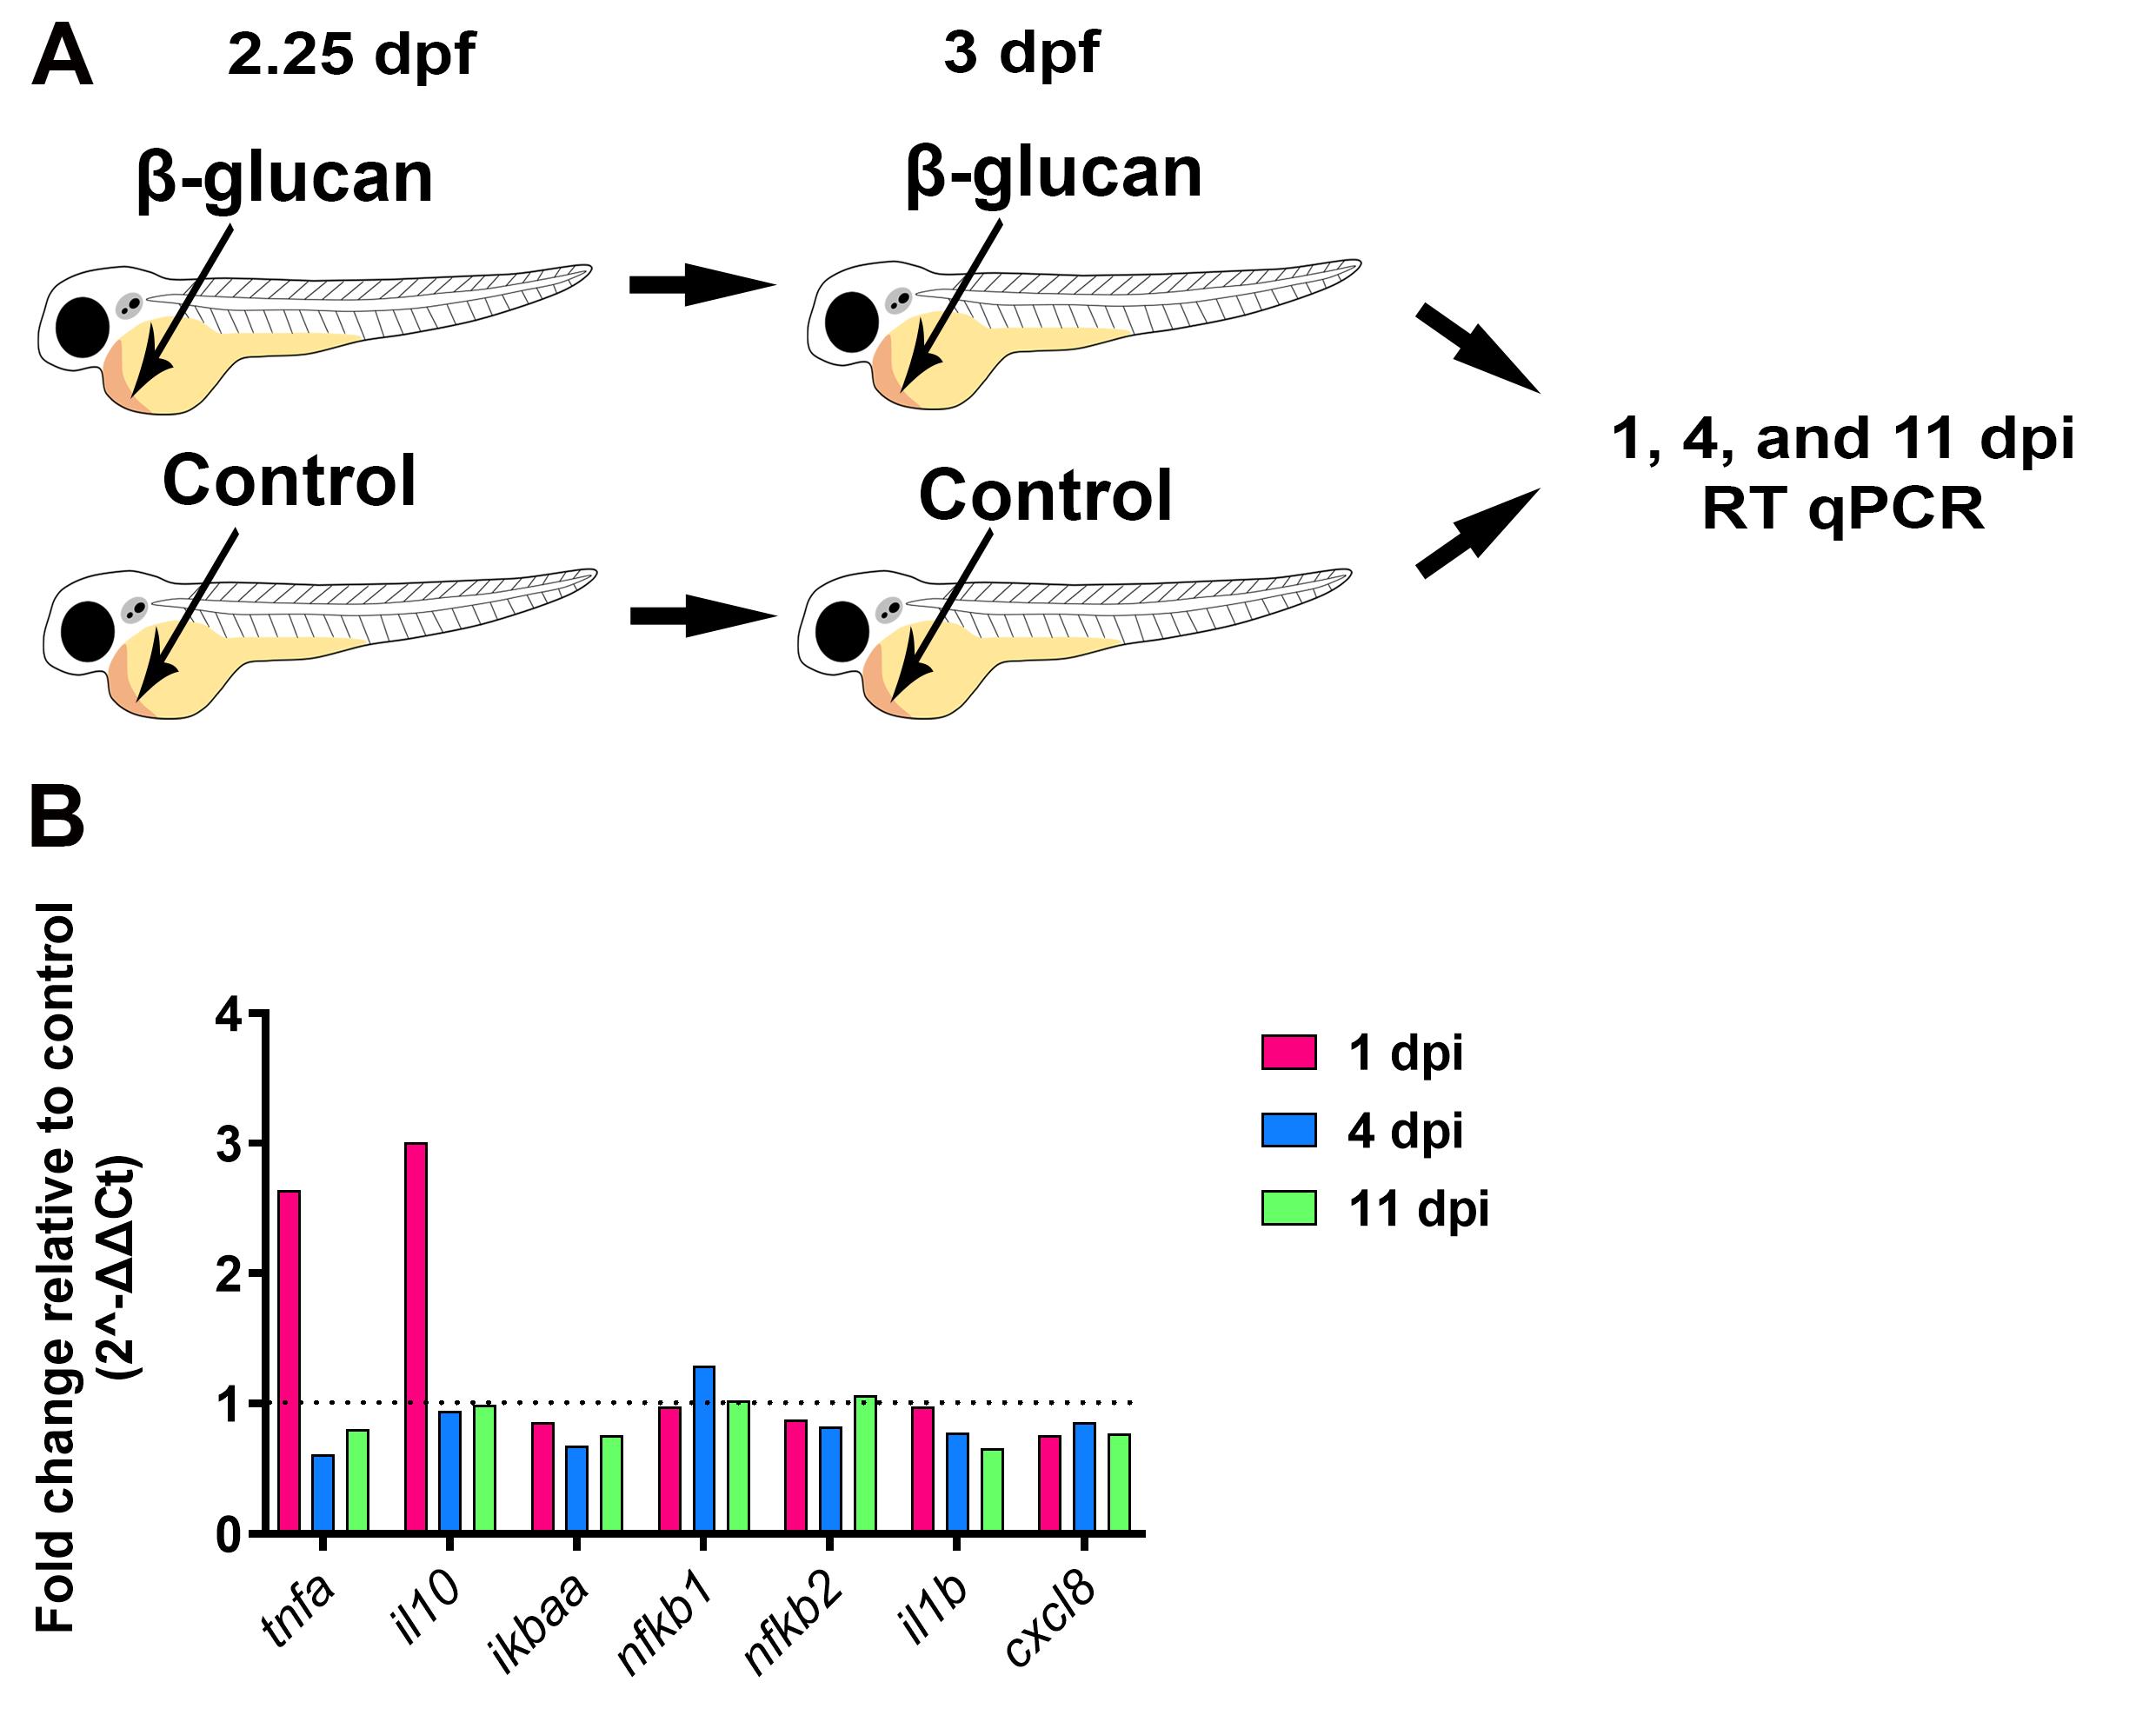
Fig. 2 Gene expression analysis following β-glucan injection. (A) Schematic illustrating the injection protocol followed by time points of sample collection for subsequent RT qPCR. (B) Fold change of relevant immune genes at 1, 4, and 11 days post injection (dpi) with β-glucan relative to control. Data shown is from averaged ΔCt values from three biological replicates, n = 15 larvae per biological replicate. Endogenous control gene was ef1a.
Acknowledgments
This image is the copyrighted work of the attributed author or publisher, and
ZFIN has permission only to display this image to its users.
Additional permissions should be obtained from the applicable author or publisher of the image.
Full text @ Bio Protoc