
Fig. 2
- ID
- ZDB-IMAGE-240304-1
- Publication
- Stegmann et al., 2024 - Bi-allelic variants in CELSR3 are implicated in central nervous system and urinary tract anomalies
- All Figures
- Figures for Stegmann et al., 2024
|
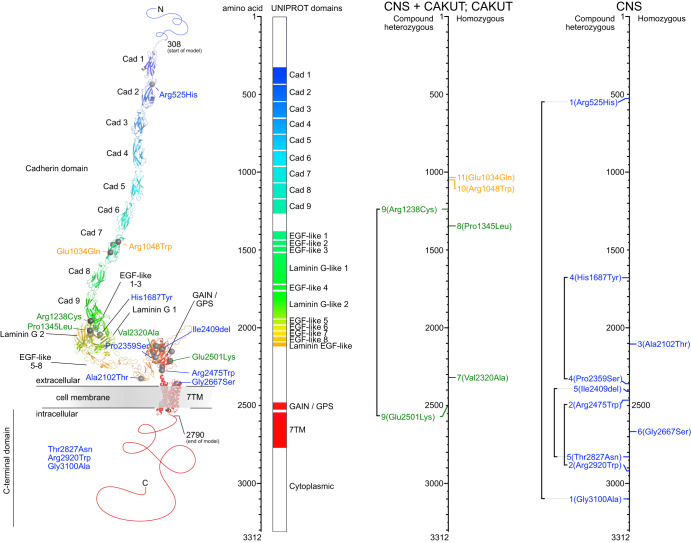
Fig. 2 Structural modeling of CELSR3 and mapping of the variants.
Structural modeling of CELSR3 and the respective variants according to the amino acid (aa) position. Left panel: 3D protein domain view and variant annotation using AlphaFold and PyMOL. Middle panel: Linearized aa view of the protein domains. Right panels: Variant location according to the respective phenotype categories: Central nervous system (CNS) anomalies in blue, combined CNS and congenital anomalies of the kidneys and urinary tract (CAKUT) in green, CAKUT only in yellow. Cad Cadherin, EGF Epidermal growth factor, GAIN G-protein-coupled receptor (GPCR) autoproteolysis-inducing domain, GPS GPCR proteolysis site, 7TM Seven-transmembrane.