
Fig. 4
- ID
- ZDB-IMAGE-240229-200
- Publication
- Rizvi et al., 2023 - VEGFA mRNA-LNP promotes biliary epithelial cell-to-hepatocyte conversion in acute and chronic liver diseases and reverses steatosis and fibrosis
- All Figures
- Figures for Rizvi et al., 2023
|
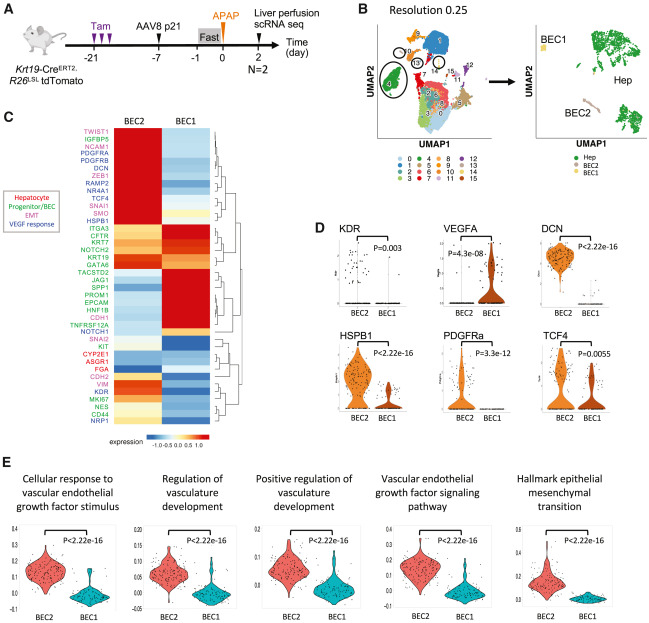
Fig. 4 KDR+ BEC fraction after liver injury is molecularly distinct from the KDR− BEC fraction and exhibits VEGF signaling response as well as an epithelial-mesenchymal transition signature (A) Experimental design for scRNA-seq experiment. In total, 2 hepatocyte and 2 NPC fractions were analyzed from 2 mice. (B) UMAP of the scRNA-seq data at the Louvain resolution 0.25. UMAP on the right was obtained after reclustering of cluster 4 (Hep), cluster 13 (BEC2), and cluster 14 (BEC1) from the UMAP on the left. (C) Heatmap of few key genes related to hepatocytes, progenitor/BEC, EMT, and VEGF response in BEC1 and BEC2 clusters. (D) Violin plots for selected genes in BEC1 and BEC2 populations. (E) Violin plots for GO biological process GSEA analysis using differential genes expressed between BEC2 and BEC1 populations. p value calculated with paired t test. See also Figure S5.