
Fig. 2
- ID
- ZDB-IMAGE-240229-198
- Publication
- Rizvi et al., 2023 - VEGFA mRNA-LNP promotes biliary epithelial cell-to-hepatocyte conversion in acute and chronic liver diseases and reverses steatosis and fibrosis
- All Figures
- Figures for Rizvi et al., 2023
|
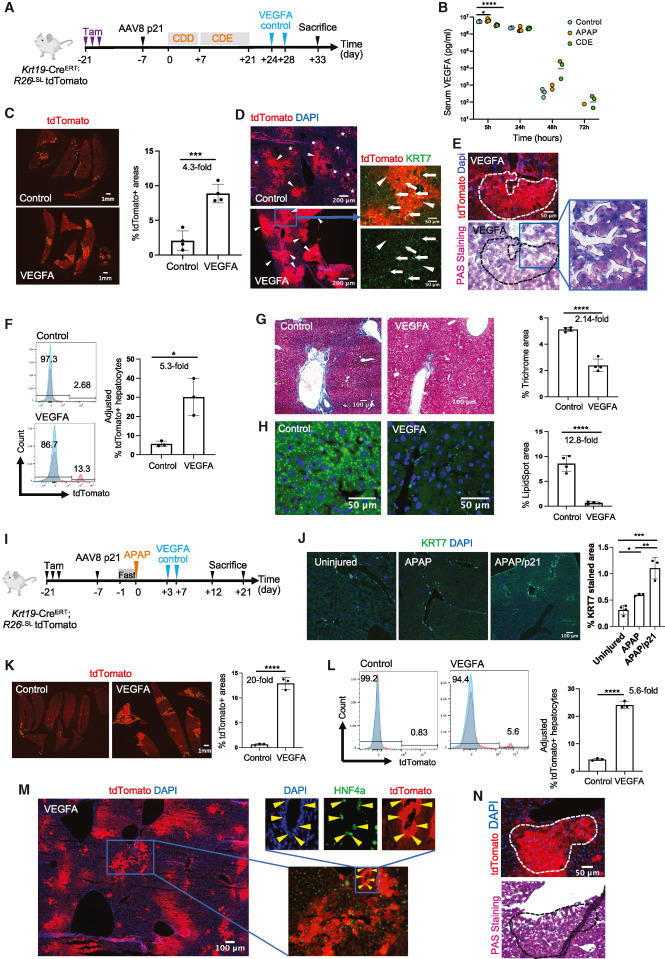
Fig. 2 VEGFA mRNA-LNP induces BEC-to-hepatocyte conversion and promotes liver repair in chronic CDE/p21 and acute APAP/p21 liver-injury models in Krt19-CreERT,R26LSLtdTomato mice (A) Schematic depicting CDE/p21 injury model in female mice. (B) Human-specific VEGFA ELISA from sera of uninjured control (n = 3), and mice injured with APAP (n = 4) or CDE (n = 4). (C) Stitched images of tdTomato+ clusters (outlined yellow) in livers from CDE/p21 injured mice. Quantification of tdTomato+ areas in both groups. (D) tdTomato+ (red) and KRT7+ (green) cells in the CDE/p21 model. Closeup images of tdTomato+ hepatocytes (arrowheads) adjacent to tdTomato+KRT7+ BECs (arrows) in VEGFA mRNA-LNP-treated mice. Asterisks represent tdTomato+ BECs. (E) tdTomato and PAS staining of serial sections of liver tissue showing glycogen storage in tdTomato+ hepatocytes in CDE/p21 model. (F) Representative histograms from flow cytometry of hepatocyte fractions from female Krt19-CreERT,R26LSLtdTomato mice treated as shown in Figure 2A. Red histograms represent the percentage of tdTomato+ populations within the hepatocyte fractions. Blue histograms represent hepatocytes from a control non-tdTomato background. Calculation of the percentage of tdTomato+ hepatocytes by extrapolating the lineage-tracing efficiency as 100% across all mice in CDE/p21 model. (G) Brightfield images and quantification of the percentage of trichrome-positive areas from three different fields in each mouse (n = 4 mice per treatment) in CDE/p21 model. (H) Images of LipidSpot staining showing lipids (green) in hepatocytes and quantification of the percentage of LipidSpot-stained areas from three different fields in each mouse (n = 4 mice per treatment) in CDE/p21 model. (I) Schematic depicting APAP/p21 injury model in female mice. (J) Immunofluorescence images and quantification of KRT7+ BECs in APAP or APAP/p21 models 12 days after APAP. (K) Stitched immunofluorescence images of tdTomato+ areas (outlined in yellow) in APAP/p21 model and quantification of tdTomato+ areas. (L) Representative histograms from flow cytometry of hepatocyte fractions isolated 21 days after APAP from male Krt19-CreERT,R26LSLtdTomato mice treated as shown in Figure 2I with 300 mg/kg APAP. Red histograms represent percentage of tdTomato+ populations within the hepatocyte fractions, and blue histograms represent the hepatocytes from a control non-tdTomato background. Calculation of the percentage of tdTomato+ hepatocytes by extrapolating the lineage-tracing efficiency as 100% across all mice. (M) Immunofluorescence images of tdTomato+ hepatocyte (arrows) in APAP/p21 model co-stained with HNF4A (green) 21 days after injury. Closeup images of HNF4A+ cells within a tdTomato+ biliary duct. (N) tdTomato and PAS staining of serial sections of liver demonstrating glycogen storage in tdTomato+ hepatocytes in APAP/p21 model 21 days after injury. Numerical data are presented as mean ± S.D. Two-tailed Student’s t test; ∗p < 0.05, ∗∗p < 0.01, ∗∗∗p < 0.001, ∗∗∗∗p < 0.0001. See also Figures S2 and S3.