IMAGE

Fig. 3

ID
ZDB-IMAGE-240229-174
Source
Figures for Veloso et al., 2024
Image
Figure Caption

Fig. 3

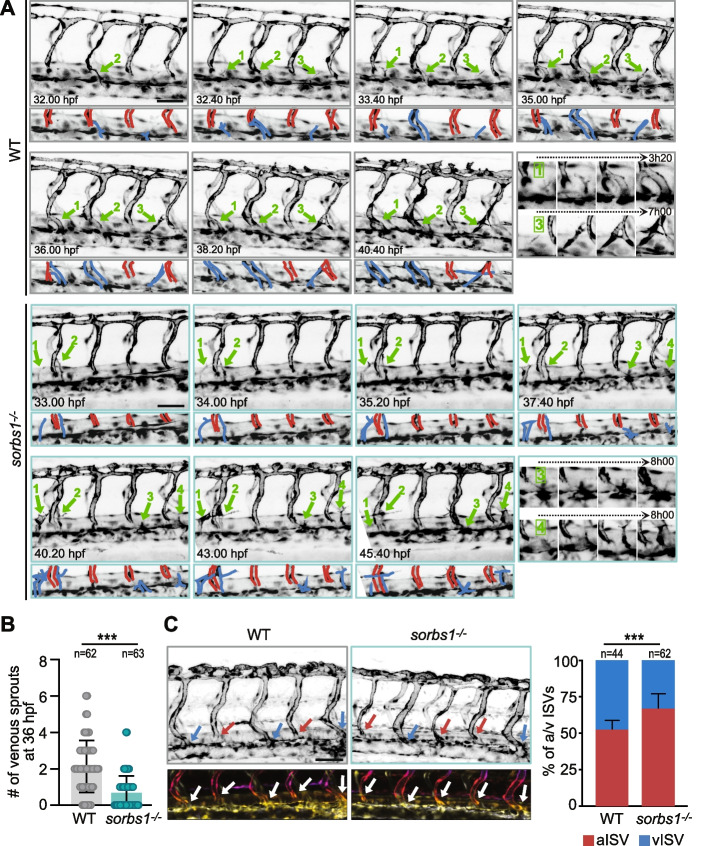
Secondary sprouting is impaired in the absence of sorbs1. A Frames (Z-maximum projections) from time-lapse confocal imaging of WT (gray boxes) and sorbs1−/− (light blue boxes) Tg(fli1a:eGFP)y1 embryos during venous secondary sprouting. Scale bar represents 50 μm. Numbered green arrows indicate sprouting events from the PCV, some of them being illustrated with zooms spanning the time indicated with the dashed arrows in the last boxes. B Quantification of secondary sprouts visible at 36 hpf in WT and sorbs1 mutants (sorbs1−/−) (n = number of embryos, ***P < 0.001; Mann–Whitney U-test). C Z-maximum projections of confocal images of the trunk vasculature of 48 hpf Tg(fli1a:eGFP)y1 WT and sorbs1 knock-out embryos. Blue and red arrows point to venous and arterial ISVs respectively and 3D color-coded stacks are shown at the bottom. Scale bar represents 50 μm. Graph shows the quantification of percentage of aISVs and vISVs at 48 hpf (n = number of embryos, *** P < 0.001; χ.2 with Yates correction)

Acknowledgments
This image is the copyrighted work of the attributed author or publisher, and ZFIN has permission only to display this image to its users. Additional permissions should be obtained from the applicable author or publisher of the image. Full text @ BMC Biol.