
|
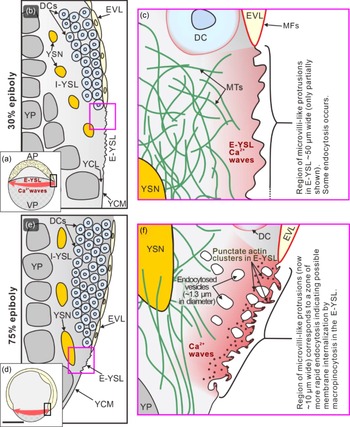
Fig. 4 Schematic to summarize our new findings and suggestions regarding the membrane surface protrusions, endocytosis and actin in the E-YSL during epiboly. The illustrations show embryos at (a–c) 30% epiboly and (d–f) 75% epiboly. The regions bounded by the black rectangles in (a) and (d) are shown at a higher magnification in (b) and (e), respectively, and the regions bounded by the pink squares in (b) and (e) are shown at a higher magnification in (c) and (f), respectively. AP, animal pole; VP, vegetal pole; DCs, deep cells; EVL, enveloping layer; E-YSL, external yolk syncytial layer; I-YSL, internal yolk syncytial layer; MTs, microtubules; MFs, microfilaments; YCM, yolk cell membrane; YCL, yolk cytoplasmic layer; YP, yolk platelets; YSN, yolk syncytial nuclei. Gilland et al. (1999) and Yuen et al. (2013) were the first to visualize Ca2+ waves traversing the blastoderm margin (including E-YSL), whereas the presence of a network of MTs in the E-YSL was first reported by Solnica-Krezel and Driever (1994). Scale bar, 250 µm (a, d); other images not drawn to scale.