
|
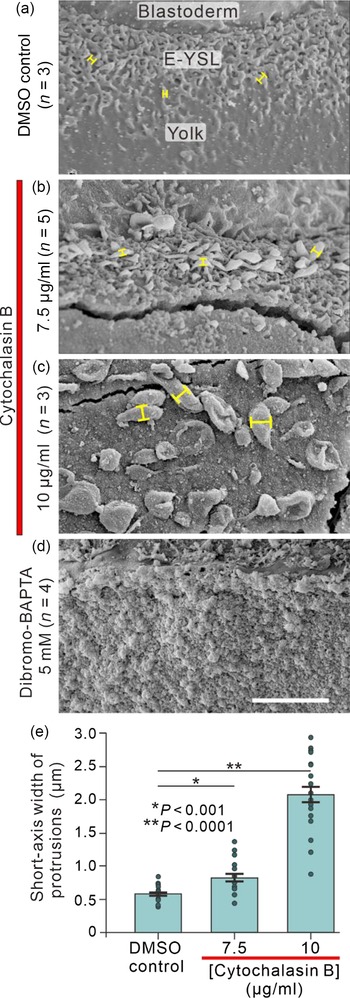
Fig. 3 The effect of cytochalasin B and 5,5′-dibromo-BAPTA on the morphology of the membrane surface protrusions in the E-YSL at 75% epiboly. Scanning electron microscopy images showing the region of the E-YSL in (a) a representative DMSO-treated control embryo and in embryos incubated with (b, c) cytochalasin B at (b) 7.5 µg/ml or (c) 10 µg/ml, or (d) injected with 5,5′-dibromo-BAPTA to a final concentration of 5 mM. Scale bar is 10 µm. (e) Bar chart with mean ± SEM and individual data points to show the effect of cytochalasin B on the width of the short-axis dimension of the E-YSL membrane surface protrusions (examples indicated by the yellow measurement lines in panels a–c) when compared with the control. Asterisks indicate cytochalasin B data that are significantly different from the control at *P < 0.001 and **P < 0.0001, as determined by the Mann–Whitney U-test.