IMAGE

Fig. 1

ID
ZDB-IMAGE-240229-136
Source
Figures for Kirchberger et al., 2024
Image
Figure Caption

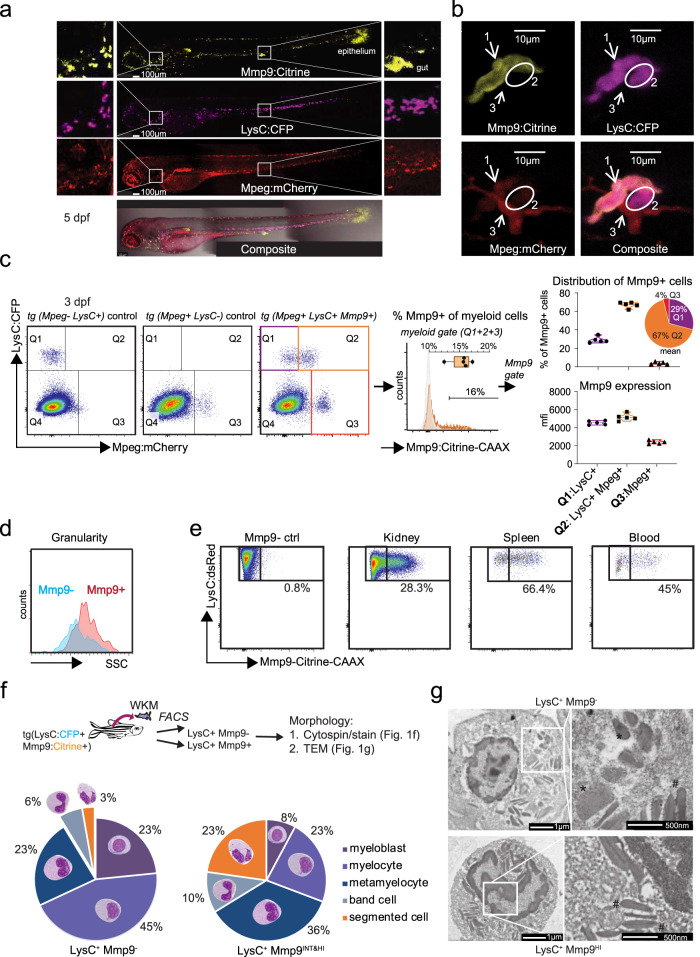
Fig. 1 mmp9:Citrine identifies mature neutrophils.

a Confocal images of triple transgenic larvae Tg(lysC:CFP-NTR)vi002/ Tg(BACmmp9:Citrine-CAAX)vi003/ Tg(mpeg:mCherry)gl23 reveal myeloid cells with different expression levels of the three analyzed markers. Stitched whole-mount images of a 5 dpf (days post fertilization) larva. n = 3. b High magnification showing presence of three different cell types: #1 neutrophil: lysC:CFP+mpeg:mCherry+/  mmp9:Citrine+; #2 neutrophil: lysC:CFP+/ mpeg:mCherry-/ mmp9:Citrine-; #3 macrophage: lysC:CFP-mpeg:mCherry+/ mmp9:Citrine-. c Flow cytometric analysis (BD LSRFortessa) of myeloid cells from mpeg:mCherry-lysC:CFP+ control larvae, lysC:CFP-mpeg:mCherry+ controls, or triple transgenic larvae lysC:CFP+/ mmp9:Citrine+/ mpeg:mCherry+(dot plots left to right) at 3 dpf. Histogram and box plot showing expression of mmp9:Citrine in myeloid cells (combined gates of Q1, Q2, Q3; Minimum = 12.4%, Maximum = 17.1%, Median = 15.7%; Box 25th−75th percentile). Violin plots indicating the distribution and expression levels of mmp9:Citrine among myeloid populations (mmp9:Citrine+ gate; n = 5 with pools of 15 triple transgenic larvae each). mfi = mean fluorescence intensity (d) mmp9:Citrine+ neutrophils (red histogram) have a higher side scatter (SSC) and therefore granularity compared to mmp9:Citrine- neutrophils (blue histogram). Flow cytometric analysis of cells isolated from Tg(lysC:CFP-NTR)vi002/ Tg(BACmmp9:Citrine-CAAX)vi003 at 2 dpf. Cells were gated on the lysC:CFP+/ mmp9:Citrine+ or lysC:CFP+/ mmp9:Citrine- populations and analyzed for SSC (n = 3). e Cells were isolated from kidneys, spleen or blood of adult Tg(lysC:dsRed)nz50Tg/ Tg(BACmmp9:Citrine-CAAX)vi003 and analyzed by flow cytometry for frequency of Mmp9+ cells. f Neutrophils were isolated from whole kidney marrow (WKM) of adult Tg(lysC:dsRed)nz50Tg/ Tg(BACmmp9:Citrine-CAAX)vi003 zebrafish and sorted into lysC:dsRed+/ mmp9:Citrine+or lysC:dsRed+/ mmp9:Citrine- populations, cytospins were prepared and Pappenheim stained. Different neutrophil maturation stages were scored blinded, showing that the lysC:dsRed+/ mmp9:Citrine+ population consists of highly differentiated neutrophil stages. INT = intermediate; HI = high. Graph presents average percentages of n = 4 kidneys (721 Mmp9+ cells and 819 Mmp9- cells were analyzed in total). g Representative ultrastructural images show an unsegmented nucleus and round and elongated granules in lysC:CFP+/ mmp9:Citrine- cells (n = 5 from one TEM transmission electron microscopy experiment) contrasting with a segmented nucleus and predominantly elongated granules in lysC:CFP+/ mmp9:CitrineHIcells (n = 2); *, round granules; #, elongated granules.

Acknowledgments
This image is the copyrighted work of the attributed author or publisher, and ZFIN has permission only to display this image to its users. Additional permissions should be obtained from the applicable author or publisher of the image. Full text @ Nat. Commun.