
Image
|
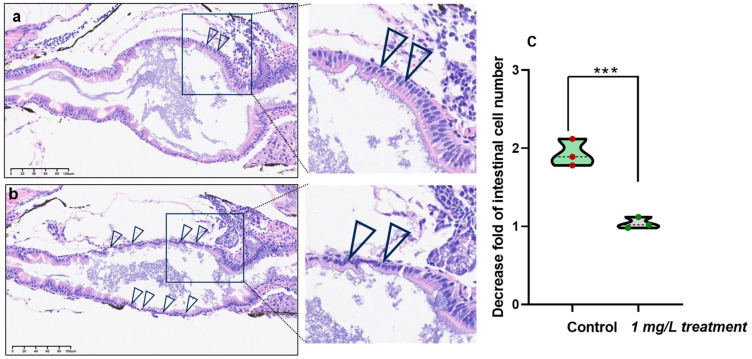
Figure Caption
Figure 7
Visualization of intestinal cell defects in zebrafish after exposure to 1 mg/L PEDOT:PSS. At 120 hpf, the entire zebrafish intestinal tract was analyzed and visualized for control groups (
Acknowledgments
This image is the copyrighted work of the attributed author or publisher, and
ZFIN has permission only to display this image to its users.
Additional permissions should be obtained from the applicable author or publisher of the image.
Full text @ Toxics