IMAGE

Figure 5

ID
ZDB-IMAGE-240226-193
Source
Figures for Yang et al., 2024
Image
Figure Caption

Figure 5

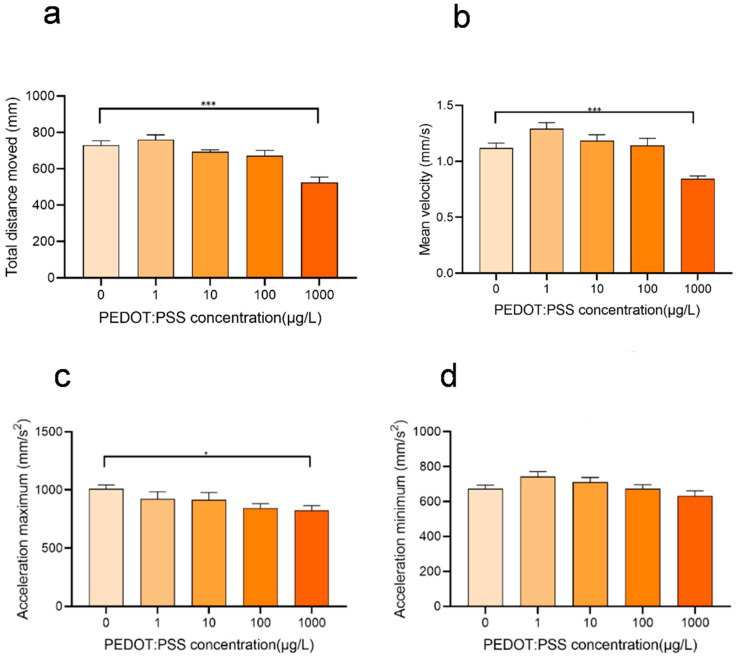
The results of the behavioral tests conducted on zebrafish at 120 hpf. (a) Total distance movement; (b) Mean velocity; (c) Maximum acceleration; (d) Minimum acceleration. The experiment was repeated five times, and the results are expressed as mean ± standard deviation. There was a statistically significant difference between the control and exposure group with * p < 0.05 and *** p < 0.001.

Acknowledgments
This image is the copyrighted work of the attributed author or publisher, and ZFIN has permission only to display this image to its users. Additional permissions should be obtained from the applicable author or publisher of the image. Full text @ Toxics