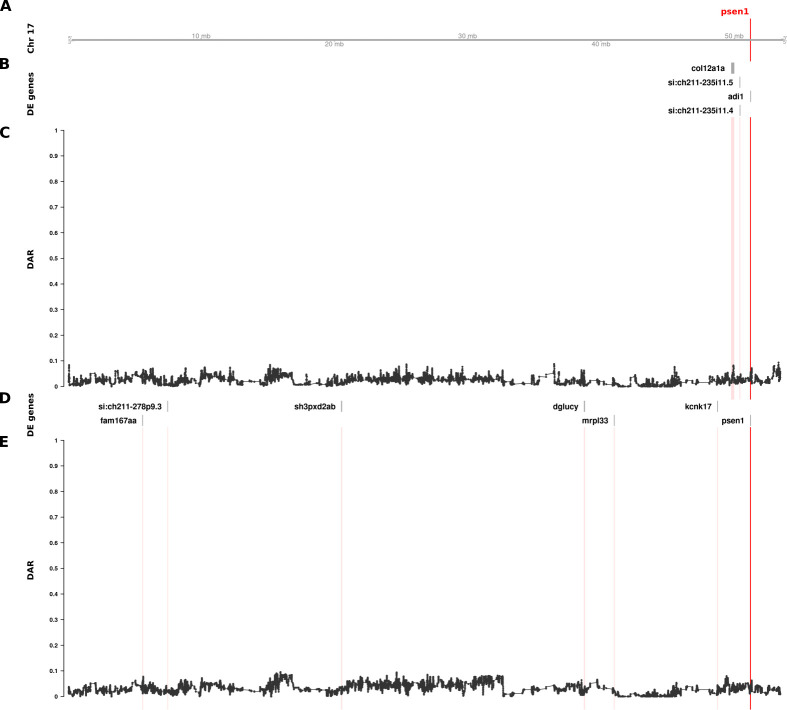
IMAGE

Fig 5

ID
ZDB-IMAGE-240226-113
Source
Figures for Baer et al., 2024
Image
Figure Caption

Fig 5 The relationship between DE genes and DAR along the entirety of zebrafish Chromosome 17 in brain transcriptome comparisons of 6-month-old wild type fish against sibling fish heterozygous for either of two different psen1 mutations.

Track A represents the axis of Chromosome 17. The position of psen1 is marked and labelled in bold red. Tracks B and C show the results from the EOfAD-relevant psen1T428del/+ vs. psen1+/+ comparison, while tracks D and E show the fAI-relevant psen1W233fsl/+ vs. psen1+/+ comparison. Tracks B and D display DE genes from their respective comparisons, while tracks C and E show the trend in DAR as a connected scatterplot with each point representing the DAR value at a single nucleotide variant position (elastic sliding window, n = 11 variants). The positions of DE genes are highlighted on the DAR tracks in a light red colour.

Acknowledgments
This image is the copyrighted work of the attributed author or publisher, and ZFIN has permission only to display this image to its users. Additional permissions should be obtained from the applicable author or publisher of the image. Full text @ PLoS Comput. Biol.