
IMAGE
Fig. 4
- ID
- ZDB-IMAGE-240222-39
- Publication
- Cassidy et al., 2023 - Systematic analysis of proximal midgut- and anorectal-originating contractions in larval zebrafish using event feature detection and supervised machine learning algorithms
- All Figures
- Figures for Cassidy et al., 2023
Image
|
Figure Caption
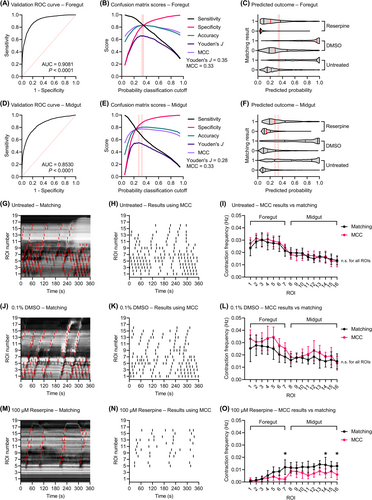
Fig. 4 Testing performance of multiple logistic regression models using the validation dataset. (A, D) ROC curves for the foregut and midgut models. (B, E) Confusion matrix scores for probability classification cutoffs of 0.05–0.95. Peak cutoffs for the Youden's J
Acknowledgments
This image is the copyrighted work of the attributed author or publisher, and
ZFIN has permission only to display this image to its users.
Additional permissions should be obtained from the applicable author or publisher of the image.
Full text @ Neurogastroenterol. Motil.