
|
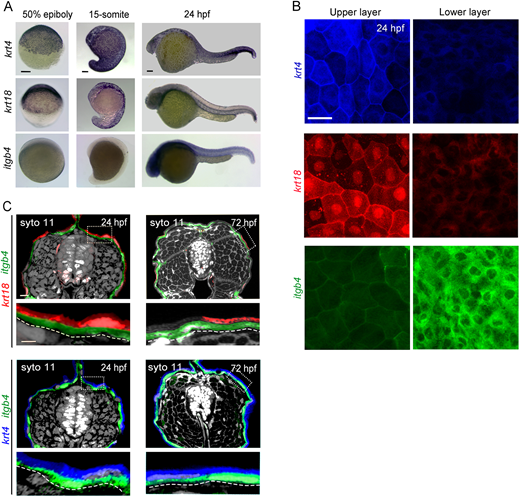
Fig. 2 Epidermal cells become mosaic at 15-somite stage. (A) ISH analysis of krt4, krt18 and itgb4 expressions. krt4 was detected in all embryonic stages. krt18 was expressed in early embryonic stage, but the expression declined after the somite stage. itgb4 was only detected after 24 hpf. At the somite stage onward, epithelial cells have a mosaic expression of krt4 and krt18. Scale bars: 50 µm. (B) Confocal images of upper and lower layers of epithelial cells of Tg(krt4:tagBFP-nfsB), Tg(krt18:mcherry) or Tg(itgb4:mcherry) in the trunk region at 24 hpf. Scale bar: 20 µm. (C) Confocal images of the cross section of Tg(krt18:mcherry;itgb4:tagBFP-nfsB) (upper panels) and Tg(krt4:tagBFP-nfsB;itgb4:mcherry) (lower panels) in the middle trunk region at 24 hpf and 72 hpf. Fluorescence of krt4, krt18, itgb4 and SYTO11 are shown in blue, red, green and white pseudocolours, respectively. The expression of itgb4 is localised in the basal layer. Scale bar: 20 µm. Boxed areas (broken lines) are shown in the lower panels. Curved dashed lines indicate basement membrane.