
IMAGE
Figure 2
- ID
- ZDB-IMAGE-240219-18
- Publication
- Benchoula et al., 2024 - 1H NMR metabolomics insights into comparative diabesity in male and female zebrafish and the antidiabetic activity of DL-limonene
- All Figures
- Figures for Benchoula et al., 2024
Image
|
Figure Caption
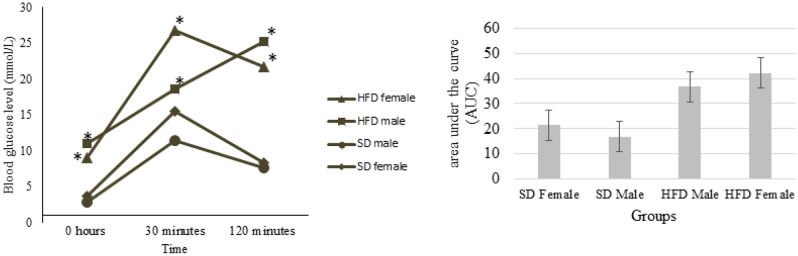
Figure 2
Glucose tolerance test (GTT) and area under the curve (AUC) of male and female zebrafish fed an HFD versus SD. Blood glucose levels were measured after fasting for 0, 30, and 120 min, and following an oral dose of 1.25 mg glucose/g body weight; Values are means (± SD), (*
Figure Data
Acknowledgments
This image is the copyrighted work of the attributed author or publisher, and
ZFIN has permission only to display this image to its users.
Additional permissions should be obtained from the applicable author or publisher of the image.
Full text @ Sci. Rep.