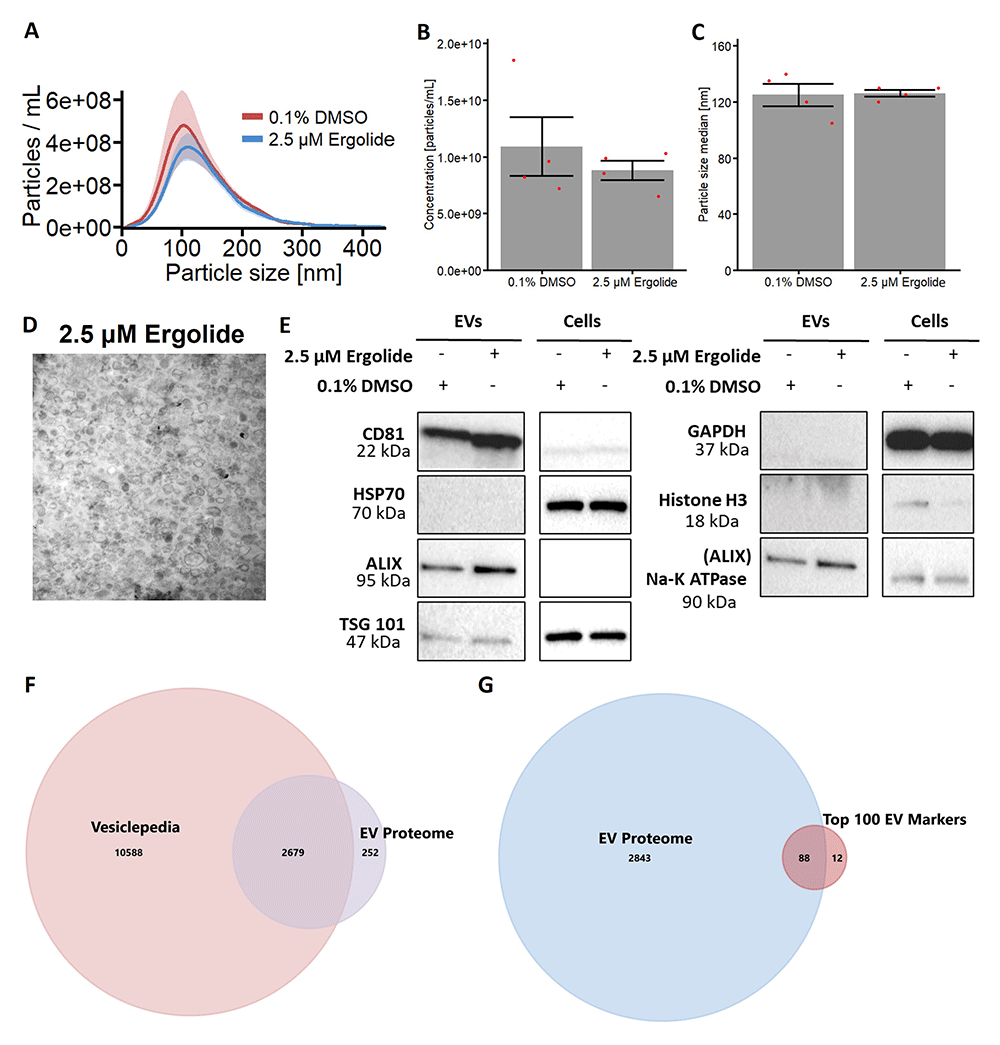
Fig. 4 Characterization of EV isolated from OMM2.5 cells. (A) NTA analysis of isolated OMM2.5 EV particle size ranging from 50 nm to 250 nm in both 0.1% treated DMSO and 2.5 μM ergolide treated samples. (B and C) A significant difference in the amount of particles and particle size was not observed between ergolide treated samples and vehicle control. (D) TEM image of particles isolated from OMM2.5 cells. (E) Immunoblot analysis of select proteins in OMM2.5 EV isolates and cell lysate (N = 1). (F) Comparison between Vesiclepedia compendium and EV proteome. (G) 88 proteins from the list of top 100 EV markers identified in OMM2.5 EV proteome.
Image
Figure Caption
Acknowledgments
This image is the copyrighted work of the attributed author or publisher, and
ZFIN has permission only to display this image to its users.
Additional permissions should be obtained from the applicable author or publisher of the image.
Full text @ Open Res Eur

