IMAGE

Fig 3

ID
ZDB-IMAGE-240214-17
Source
Figures for Tanner et al., 2024
Image
Figure Caption

Fig 3

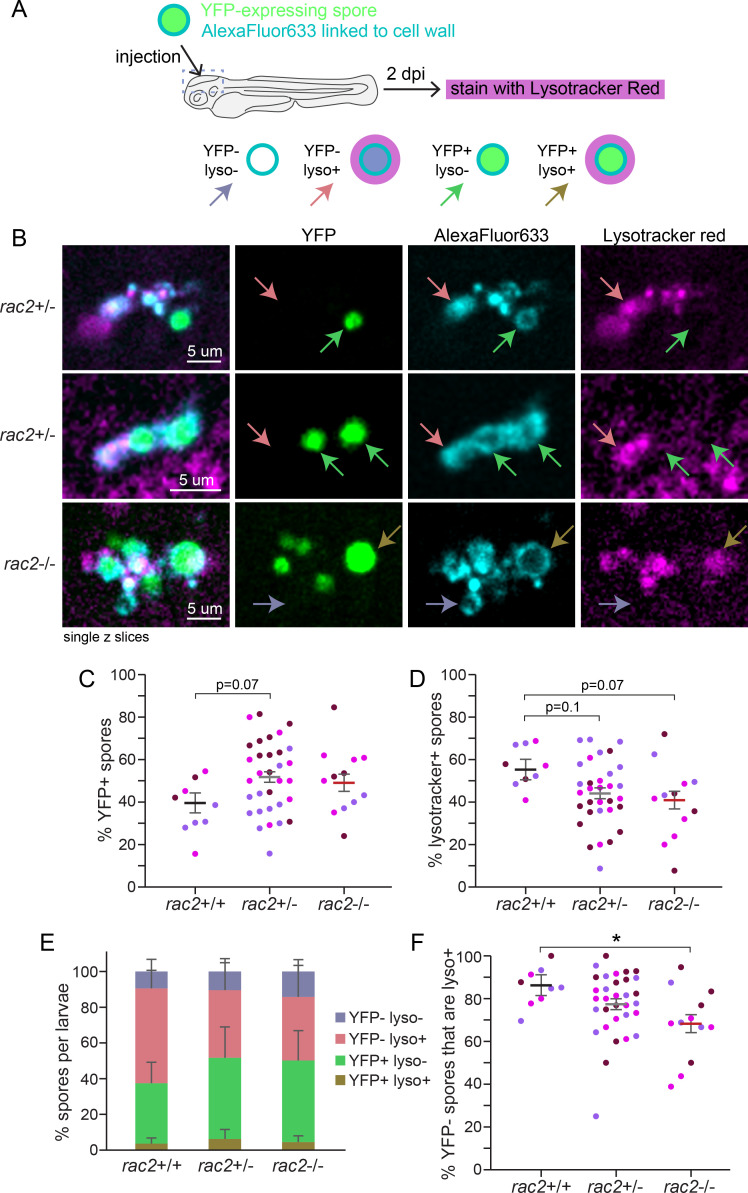
Rac2 is not required for spore acidification or killing. rac2+/− adult fish were crossed to each other, and the resulting larvae were injected with YFP-expressing and AlexaFluor633-cell wall-conjugated TBK1.1 (Af293) spores. At 2 dpi, larvae were stained with Lysotracker Red and live imaged and then genotyped. Average number of spores enumerated per larva via microscopy at 2 dpi = 40. Data represent 3 pooled replicates of 17–18 larvae per replicate. (A) Experimental schematic. (B) Example images showing killed spores in non-acidified compartments (YFP−, AF+, lyso−; purple arrow), killed spores in acidified compartments (YFP−, AF+, lyso+; pink arrow), alive spores in non-acidified compartments (YFP+, AF+, lyso−; green arrow), and alive spores in acidified compartments (YFP+, AF+, lyso+; brown arrow). Each image shows a single z slice from a confocal image stack. (C) The percentage of alive (YFP+) spores was calculated for each larva. (D) The percentage of spores present in acidified compartments (lyso+) was calculated for each larva. (E) The average percentage of spores in each type of compartment was calculated across all larvae. (F) The percentage of killed (YFP−) spores that are found in acidified compartments (lyso+) was calculated for each larva. For (C, D, and F) each symbol represents one larva, color coded by replicate. For C–F, lines represent emmeans ± SEM. P values were calculated by ANOVA.

Figure Data
Acknowledgments
This image is the copyrighted work of the attributed author or publisher, and ZFIN has permission only to display this image to its users. Additional permissions should be obtained from the applicable author or publisher of the image. Full text @ Infect. Immun.