
|
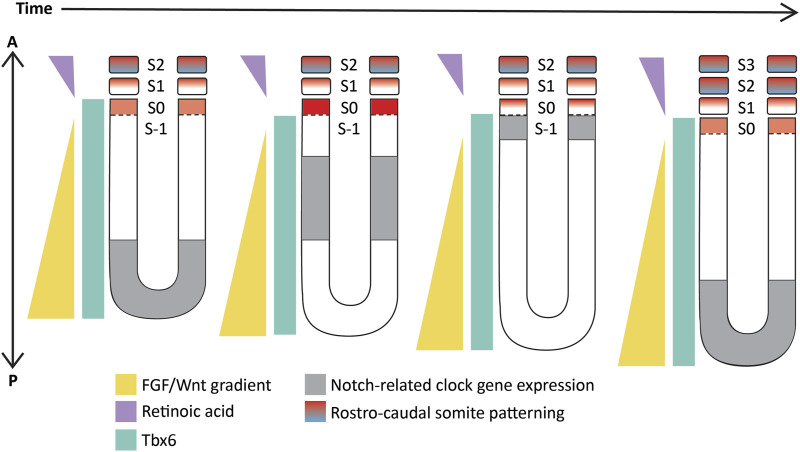
FIGURE 3
Schematic representation of the ‘Clock-and-wavefront’ model that shows the existence of a clock travelling from the posterior to the anterior PSM (in grey) coupled with a regressing wavefront (in yellow) which interact precisely with another T-box TF, Tbx6 (in cyan) to specify anterior PSM cells to differentiate into a somite. S-1: unsegmented PSM that will form the next somite; S0- The somite that is being specified; S1- The most recently formed somite; S2- The earliest formed somite that has completed rostro-caudal patterning (blue-red gradient). Illustrations adapted and modified from (