
Fig. 2
- ID
- ZDB-IMAGE-240212-8
- Publication
- Rajan et al., 2023 - Single-cell analysis reveals distinct fibroblast plasticity during tenocyte regeneration in zebrafish
- All Figures
- Figures for Rajan et al., 2023
|
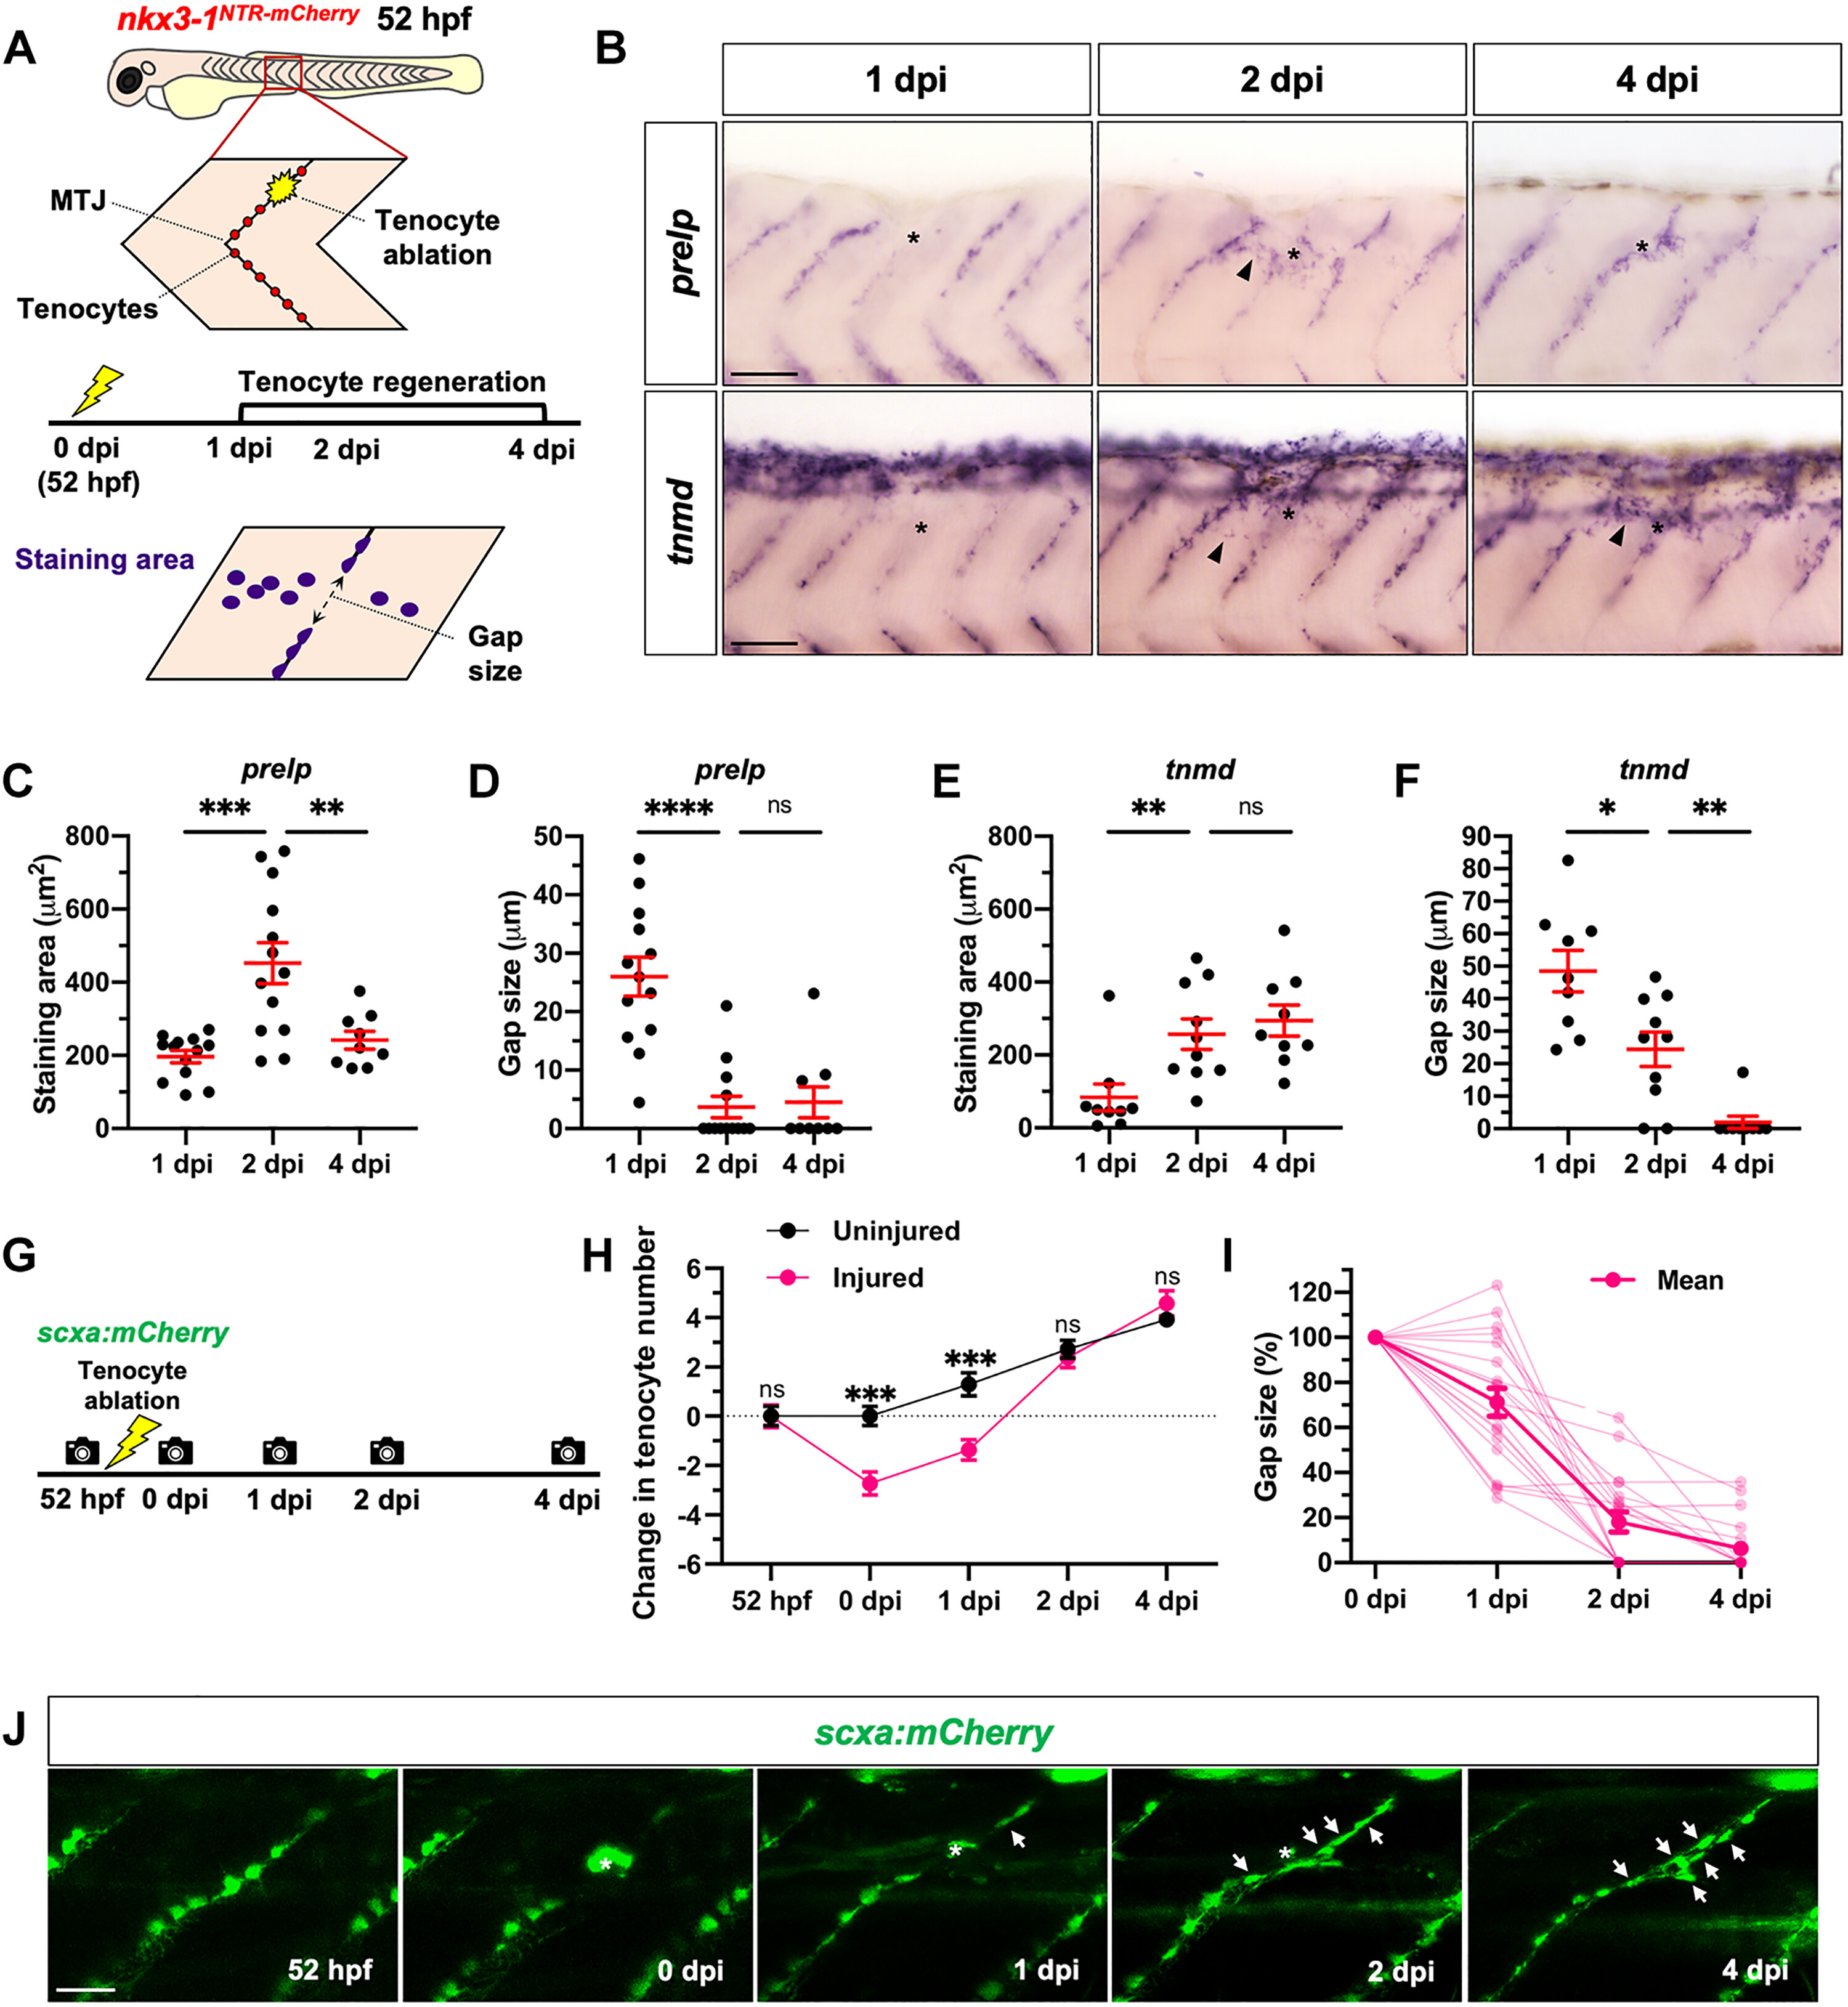
Fig. 2 Zebrafish can regenerate trunk tenocytes after laser ablation. (A) Schematic representation of tenocyte ablation protocol and quantification shown in (B) to (F). (B) In situ hybridization for tenocyte markers, prelp (top) and tnmd (bottom), at 1, 2, and 4 dpi showing increased gene expression (arrowheads) around the injury region (asterisks) at 2 dpi. n = 9 to 13 embryos per probe at each stage. (C to F) Quantification of staining area and gap size in stained embryos as described in (A). (G) Experimental protocol to track tenocyte regeneration in live scxa:mCherry embryos. (H) Change in tenocyte number from 52 hpf to 4 dpi along injured and uninjured MTJs. (I) Quantification of gap between adjacent tenocytes at the injury site in each embryo from 0 to 4 dpi. (J) Representative images of one injured embryo from 52 hpf to 4 dpi, with several newly regenerated tenocytes (arrows) arising at the injured MTJ. Autofluorescent scar from laser ablation indicated by asterisks. n = 14 uninjured and 19 injured MTJs from 19 embryos. All data shown as mean ± SEM. Statistics: Mann-Whitney U test [(C) to (F)]; Sidak’s multiple comparisons (H). Significance: ns (not significant), P > 0.05; *P < 0.05; **P < 0.01; ***P < 0.001; ****P < 0.0001. Scale bars, 50 μm (B) and 25 μm (J).