IMAGE

Figure 4

ID
ZDB-IMAGE-240212-78
Source
Figures for Ruan et al., 2024
Image
Figure Caption

Figure 4

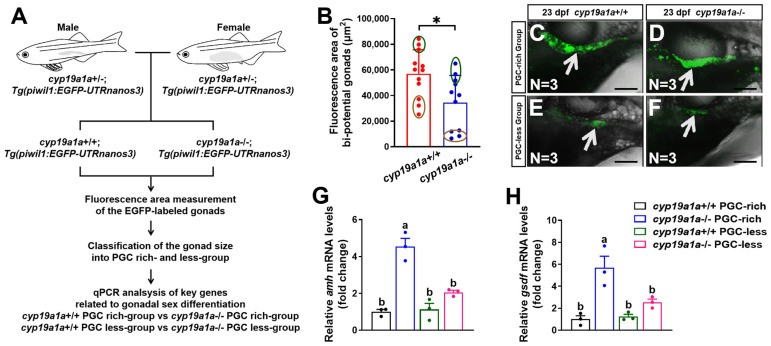
Upregulated expression of amh and gsdf was observed in cyp19a1a−/− fish of PGC-rich and PGC-less groups at 23 dpf. (A) A schematic showing the procedure of the classification according to PGC area and gene expression analyses. (B) The bi-potential gonad area of the selected cyp19a1a+/+ and cyp19a1a−/− fish at 23 dpf. Dark green circles: top three bipotential gonad area. Brown circles: last three bi-potential gonad area. (C,D) Representative images of the selected cyp19a1a+/+ and cyp19a1a−/− fish from the PGC-rich group at 23 dpf. EGFP-labeled gonads were pointed by white arrows. Scale bar, 300 µm. (E,F) Representative images of the selected cyp19a1a+/+ and cyp19a1a−/− fish from the PGC-less group at 23 dpf. EGFP-labeled gonads were pointed by white arrows. Scale bar, 300 µm. (G,H) Relative expression of amh and gsdf in cyp19a1a+/+ and cyp19a1a−/− fish of the PGC-rich and PGC-less groups at 23 dpf. n.s., no significance. * p < 0.05. Different letters in the bar charts represent significant differences.

Acknowledgments
This image is the copyrighted work of the attributed author or publisher, and ZFIN has permission only to display this image to its users. Additional permissions should be obtained from the applicable author or publisher of the image. Full text @ Int. J. Mol. Sci.