IMAGE

Figure 2

ID
ZDB-IMAGE-240212-76
Source
Figures for Ruan et al., 2024
Image
Figure Caption

Figure 2

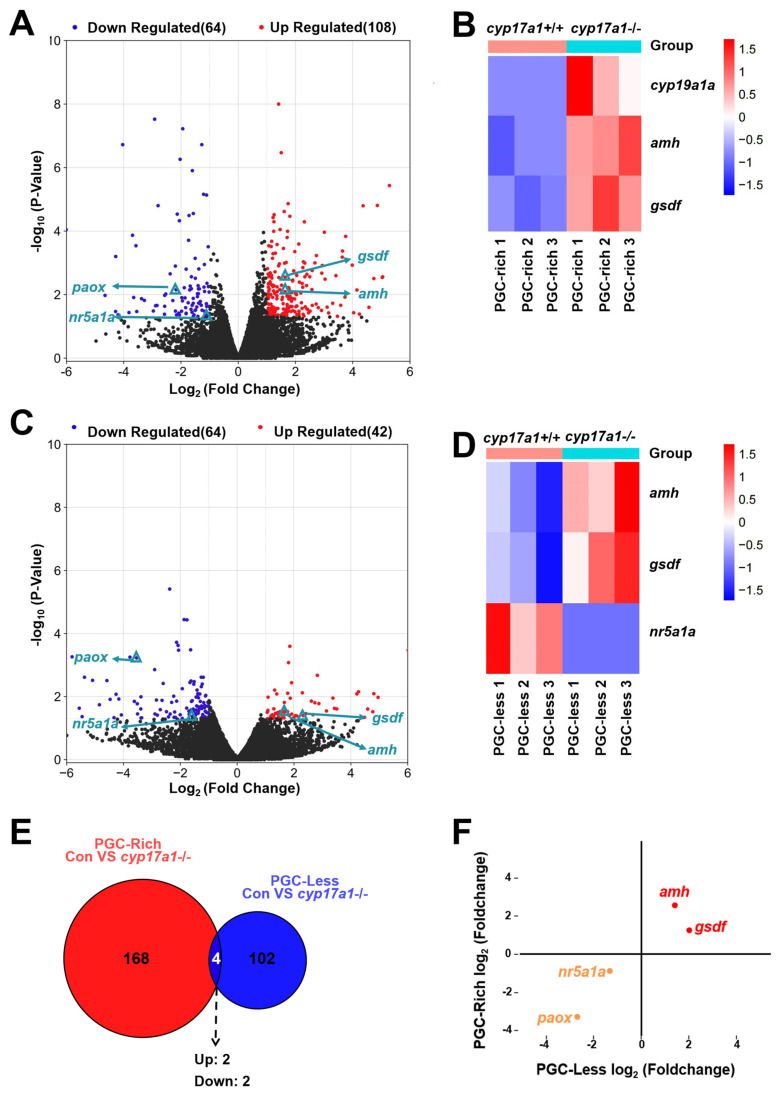
Gene expression heat map and gene set enrichment analysis. (A) DEGs from the comparison between cyp17a1+/+ and cyp17a1−/− fish of the PGC-rich group at 23 dpf. Volcano plot showing genes, including amh and gsdf, that were differentially expressed in cyp17a1+/+ and cyp17a1−/− fish of the PGC-rich group at 23 dpf. (B) Gene expression heat map of gonadal differentiation of cyp17a1+/+ and cyp17a1−/− fish of the PGC-rich group at 23 dpf. (C) DEGs from the comparison between cyp17a1+/+ and cyp17a1−/− fish of the PGC-less group at 23 dpf. Volcano plot showing genes, including amh and gsdf, that were differentially expressed in cyp17a1+/+ and cyp17a1−/− fish of the PGC-less group at 23 dpf. (D) Gene expression heat map of gonadal differentiation of cyp17a1+/+ and cyp17a1−/− fish of the PGC-less group at 23 dpf. (E) Veen analysis of DEGs. Up: upregulated. Down: downregulated. (F) Scatter plot of the intersected DEGs. Red dots: co-upregulated. Orange dots: co-downregulated.

Acknowledgments
This image is the copyrighted work of the attributed author or publisher, and ZFIN has permission only to display this image to its users. Additional permissions should be obtained from the applicable author or publisher of the image. Full text @ Int. J. Mol. Sci.