
Fig. 1
- ID
- ZDB-IMAGE-240212-7
- Publication
- Rajan et al., 2023 - Single-cell analysis reveals distinct fibroblast plasticity during tenocyte regeneration in zebrafish
- All Figures
- Figures for Rajan et al., 2023
|
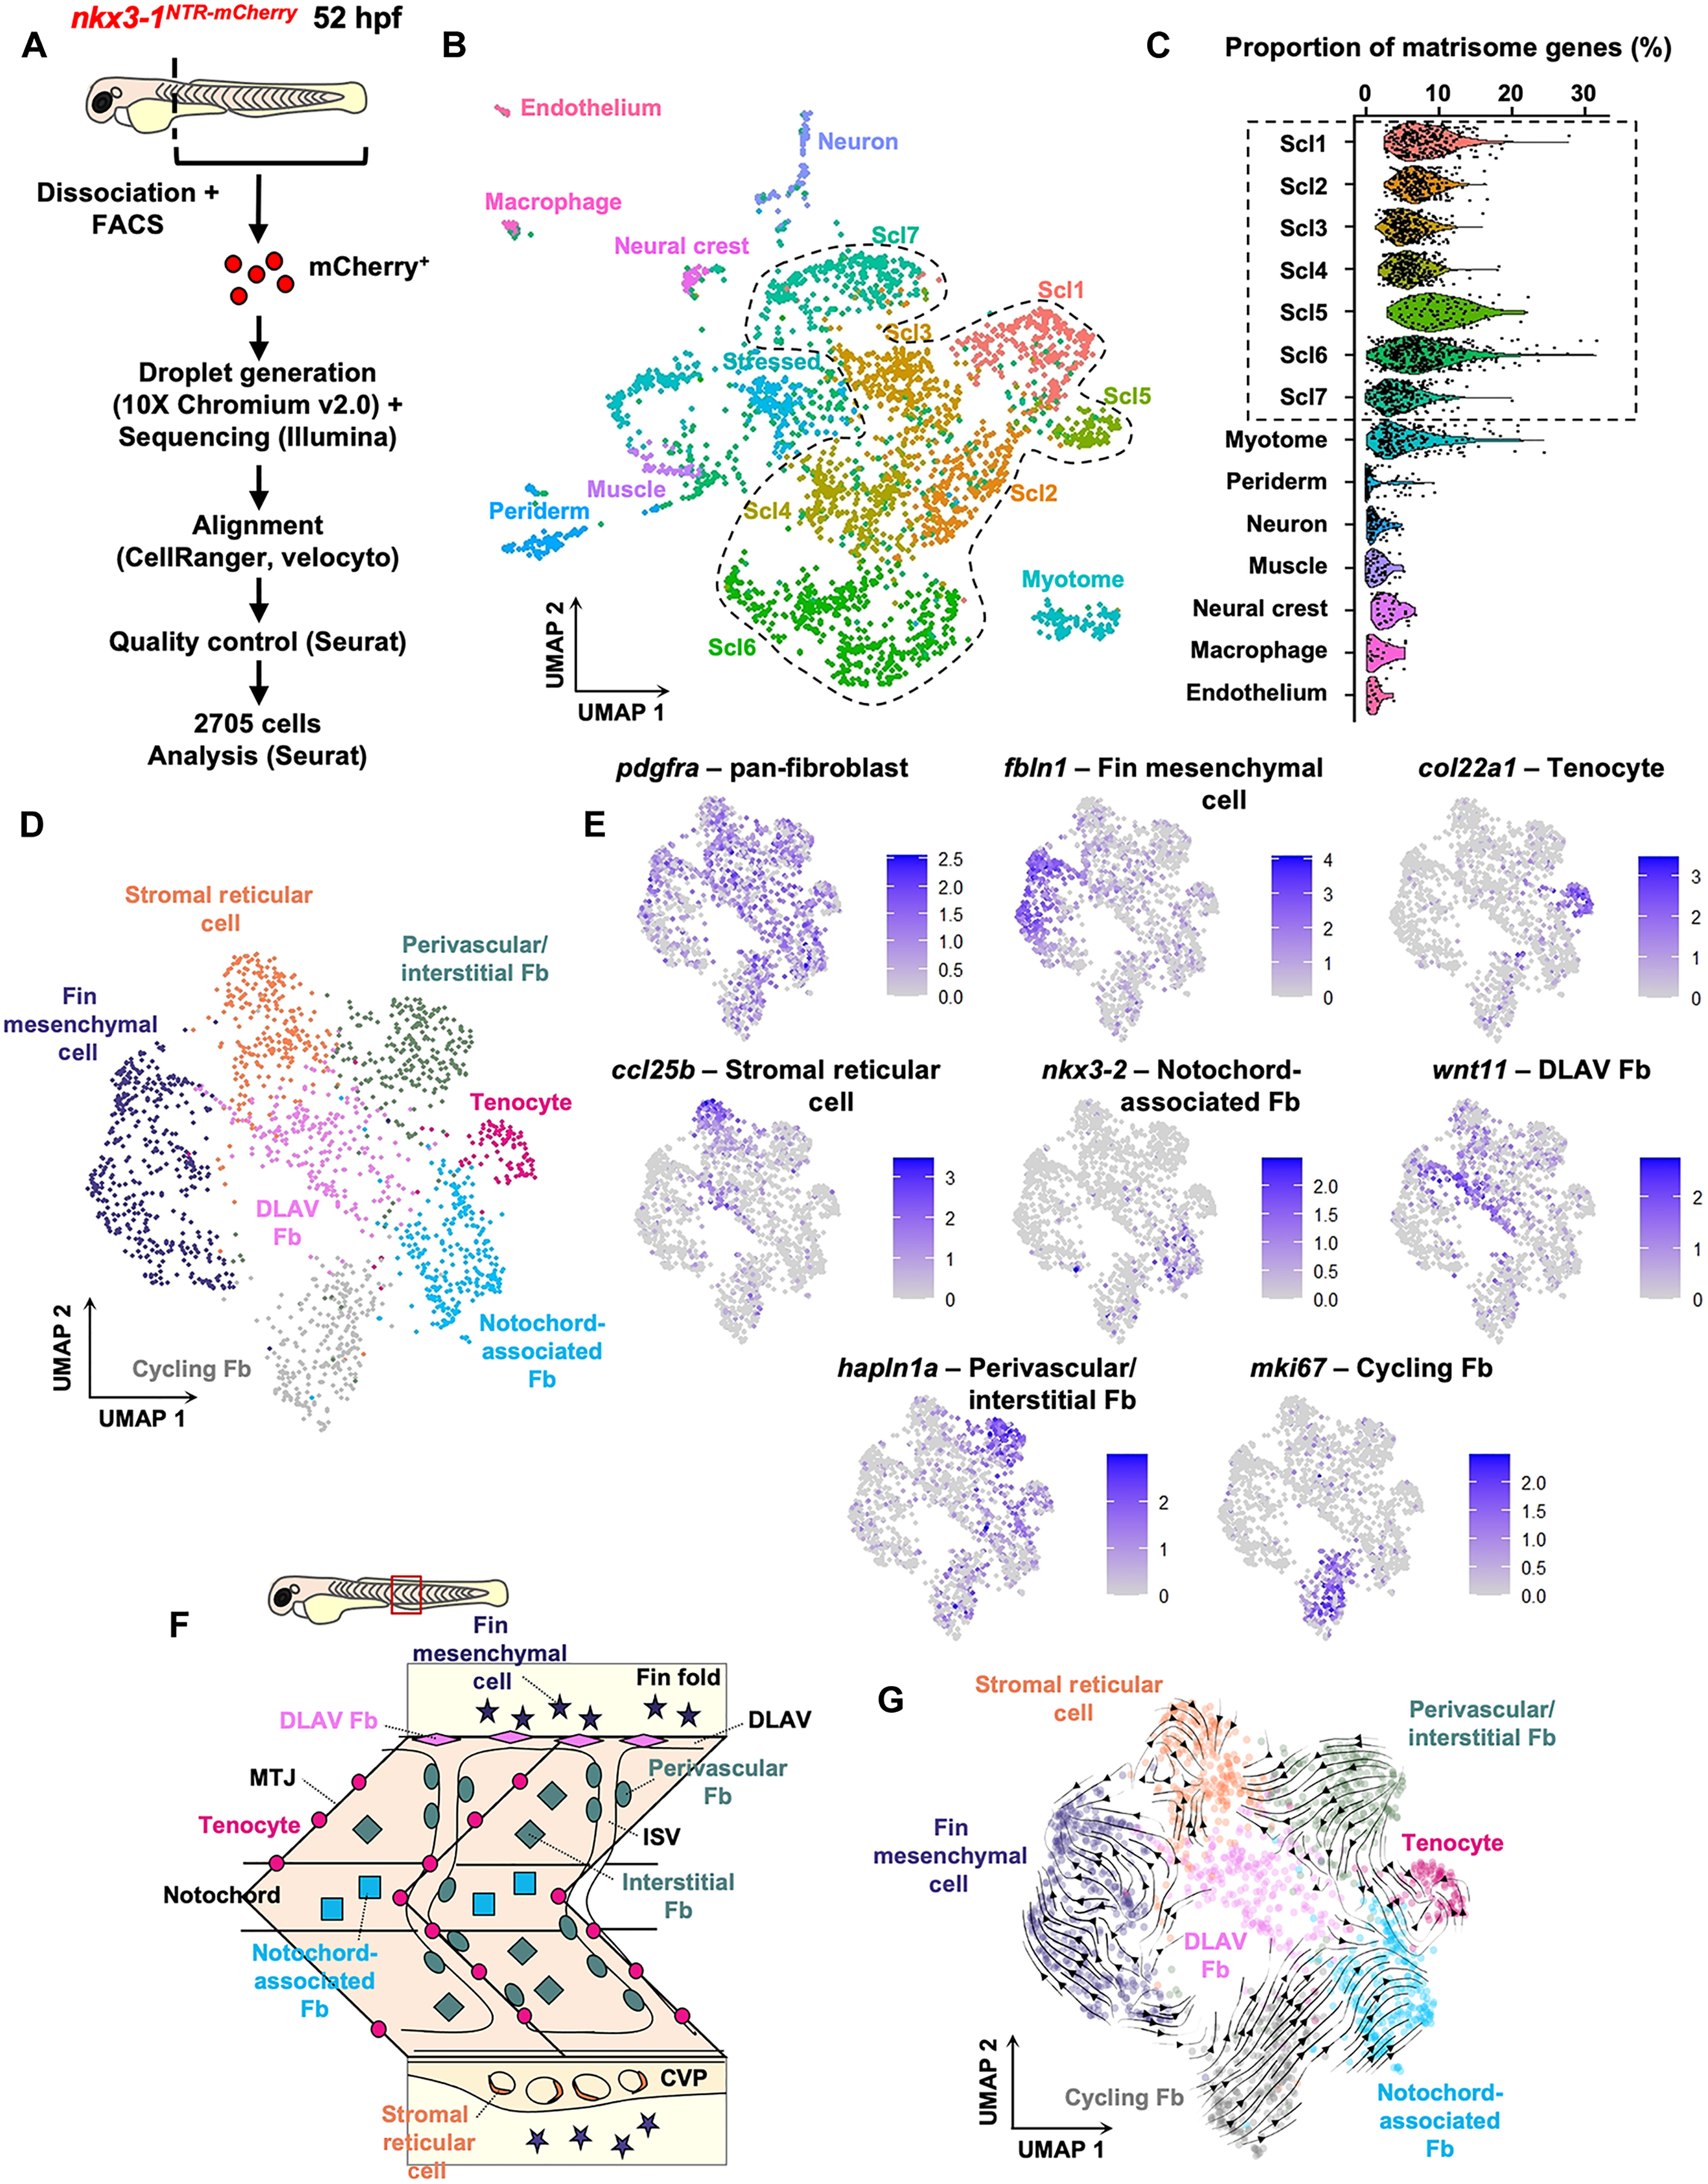
Fig. 1 scRNA-seq reveals heterogeneity and differential plasticity in sclerotome-derived fibroblasts. (A) Sample preparation pipeline for scRNA-seq of mCherry+ cells from 52 hpf nkx3-1NTR-mCherry zebrafish trunks. (B) UMAP plot of the post-filtering scRNA-seq dataset. Dotted line indicates sclerotome-derived fibroblast clusters. (C) Proportion of ECM-related (matrisomal) transcripts detected per cell, grouped by cluster. Matrisome gene expression is enriched in sclerotome-derived fibroblast clusters (dotted line). (D) UMAP representation of subsetted fibroblast clusters from (B), with distinct fibroblast subtypes labeled. (E) Feature plots showing expression of a pan-fibroblast marker, pdgfra, and one marker for each cluster identified in (D). (F) Schematic depicting distribution of fibroblast subtypes from (D) in the zebrafish trunk, as determined in figs. S4 to S6. (G) RNA velocity analysis of fibroblast clusters. Stream and arrowheads indicate direction of differentiation trajectory. CVP, caudal vein plexus; DLAV, dorsal longitudinal anastomotic vessel; Fb, fibroblast; ISV, intersegmental vessel; MTJ, myotendinous junction; Scl, sclerotome.