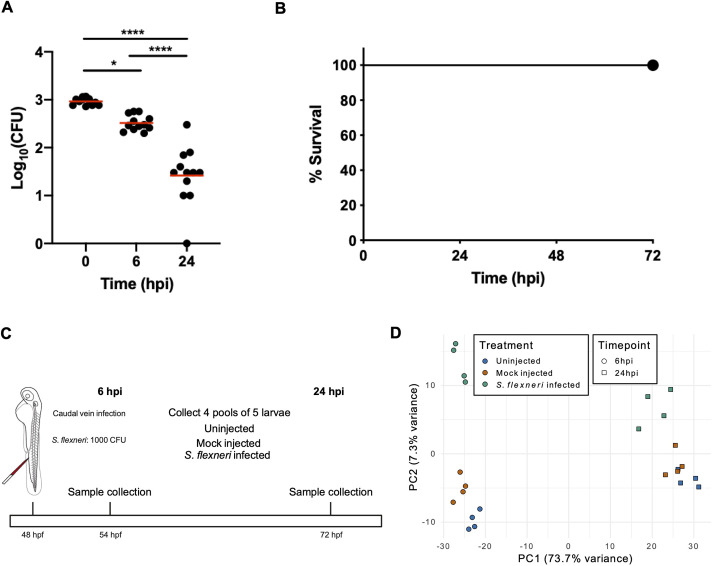
Experimental design of Shigella-zebrafish infection and transcriptomic data collection. (A,B) Log10-transformed CFU counts (A) and survival curves (B) of larvae injected via the caudal vein with 1000 CFU of S. flexneri. Injections were performed in 2-day post-fertilisation larvae. *P<0.05; ****P<0.0001 (one-way ANOVA with Tukey's multiple comparisons test). A total of 36 larvae (12 per timepoint) were sacrificed to determine the bacterial load (A), whereas a total of 63 larvae were used for the survival analysis (B). (C) Workflow of the RNA sequencing experiment. Four pools of five embryos injected with 1000 CFU of S. flexneri (or mock-injected control) at 24 h post-fertilisation (hpf) were collected at 6 and 24 h post-infection (hpi) for RNA sequencing. Uninfected embryos were also collected at the same timepoints. (D) Principal component analysis (PCA). Regularised log-transformed counts for the 2500 most variable genes across the samples were used in PCA. The first two components are plotted. PC1 separates the samples by timepoint (circle, 6 hpi; square, 24 hpi) and PC2 reflects infection status (blue, uninfected; orange, mock infected; green, S. flexneri infected).
This image is the copyrighted work of the attributed author or publisher, and
ZFIN has permission only to display this image to its users.
Additional permissions should be obtained from the applicable author or publisher of the image.
Full text @ Dis. Model. Mech.
Your Input Welcome
Thank you for submitting comments. Your input has been emailed to ZFIN curators who may contact you if
additional information is required.
Oops. Something went wrong. Please try again later.