
Image
|
Figure Caption
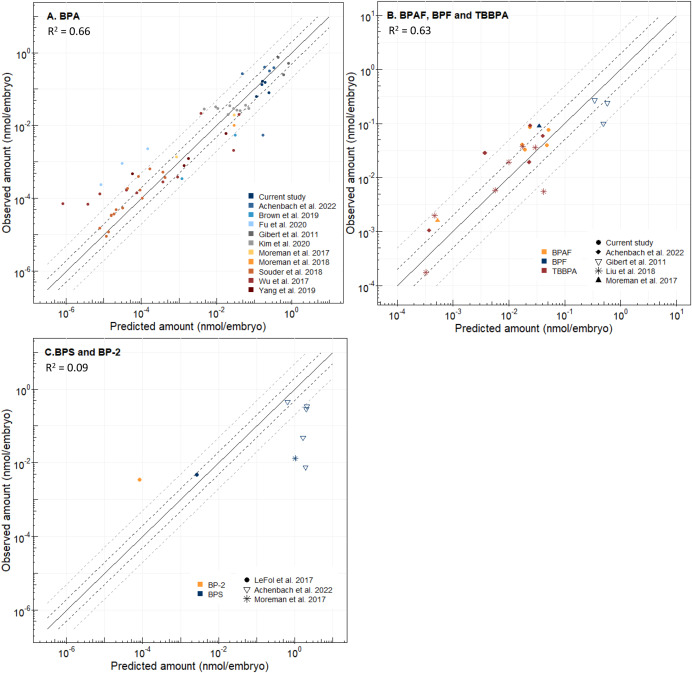
Fig. 3 Observed and predicted amount (nmol) of compound per ZFE (embryo body, yolk and chorion) for BPA (A), BPAF, BPF, TBBPA (B), BPS and BP-2 (C). Solid line represents 1:1 correlation and dotted lines represent the 2-fold (black) and 5-fold- (gray) errors. R2 was calculated for each graph. Note that all data presented in this Figure was not used in model calibration.
Acknowledgments
This image is the copyrighted work of the attributed author or publisher, and
ZFIN has permission only to display this image to its users.
Additional permissions should be obtained from the applicable author or publisher of the image.
Full text @ Chemosphere