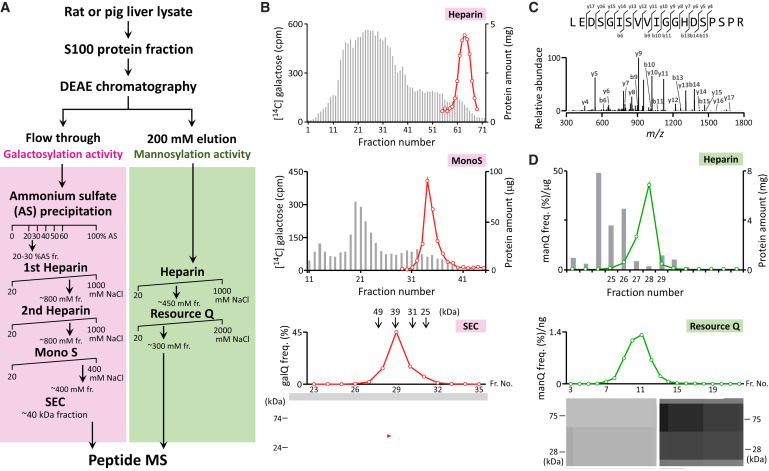
Fig. 2 Activity-based identification of Q-glycosylating enzymes (A) Fractionation scheme of QTGAL (left) and QTMAN (right). (B) Fractionation of rat QTGAL activity by heparin chromatography (top), Mono S (middle), and SEC (bottom). Gray bars indicate protein amount (mg). Red plots show QTGAL activity measured by radioactivity of 14C-galactose incorporation (heparin and Mono S) or by LC/MS of galQ nucleoside (SEC). Molecular masses of size markers are indicated above the SEC profile. Proteins in the SEC fractions are resolved by SDS-PAGE. The band indicated by a red arrowhead was assigned to QTGAL (B3GNTL1). (C) CID spectrum of a tryptic fragment of the excised protein band. b and y series product ions are assigned to the tryptic peptide of rat B3GNTL1. (D) Fractionation of pig QTMAN activity by heparin and Resource Q chromatographies. Gray bars indicate protein amount (mg). Green plots show QTMAN activity measured by LC/MS of manQ nucleoside. Proteins fractionated by Resource Q are resolved by SDS-PAGE. See also Figures S10 and S11.
Reprinted from Cell, 186(25), Zhao, X., Ma, D., Ishiguro, K., Saito, H., Akichika, S., Matsuzawa, I., Mito, M., Irie, T., Ishibashi, K., Wakabayashi, K., Sakaguchi, Y., Yokoyama, T., Mishima, Y., Shirouzu, M., Iwasaki, S., Suzuki, T., Suzuki, T., Glycosylated queuosines in tRNAs optimize translational rate and post-embryonic growth, 5517-5535.e24, Copyright (2023) with permission from Elsevier. Full text @ Cell

