
Image
|
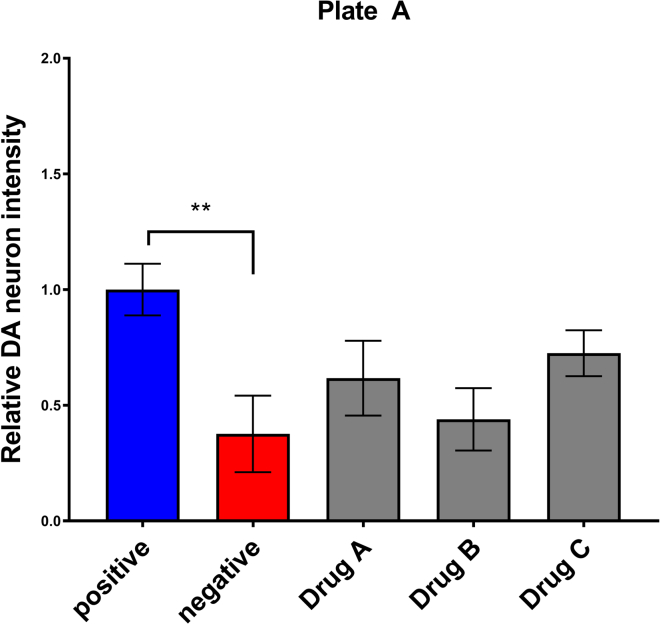
Figure Caption
Figure 5
Bar graph visualization of the screening plate analysis
A t-test between the positive control (blue) and negative control (red) shows significant DA neuron ablation. The difference between the negative control and the different treatment groups (Drug A, B, and C) should be assessed to determine the significance of a hit candidate.
Acknowledgments
This image is the copyrighted work of the attributed author or publisher, and
ZFIN has permission only to display this image to its users.
Additional permissions should be obtained from the applicable author or publisher of the image.
Full text @ STAR Protoc