
Image
|
Figure Caption
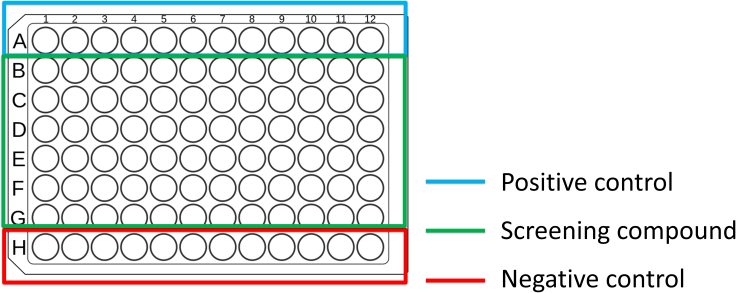
Figure 3
Example 96 well plate setup
Each row represents as a single condition (n = 12). The top and bottom row are considered positive (0.2% DMSO), and negative control (MTZ or CBE) with screening compounds + MTZ/CBE in the middle rows.
Acknowledgments
This image is the copyrighted work of the attributed author or publisher, and
ZFIN has permission only to display this image to its users.
Additional permissions should be obtained from the applicable author or publisher of the image.
Full text @ STAR Protoc