
Image
|
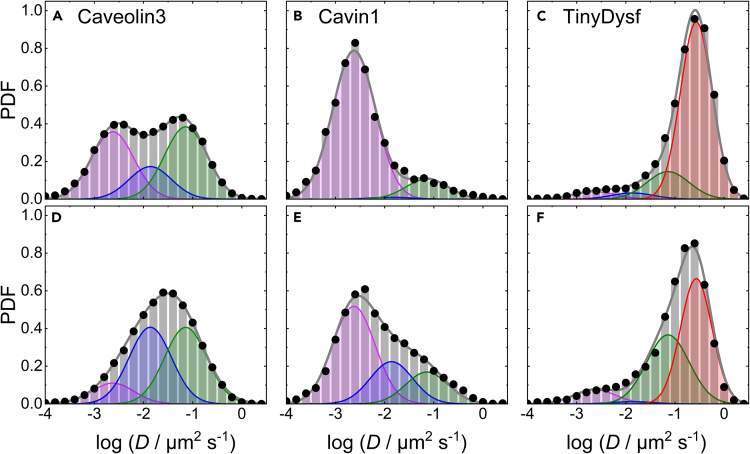
Figure Caption
Figure 4
Area-normalized histograms (PDFs) of the number of mEosFP
Top (A–C) and bottom (D–F) rows, data taken before and after lesioning, respectively. The data were obtained by MSD analysis of trajectories extracted from TIRF image sequences of C2C12 cells transiently expressing mEosFP
Acknowledgments
This image is the copyrighted work of the attributed author or publisher, and
ZFIN has permission only to display this image to its users.
Additional permissions should be obtained from the applicable author or publisher of the image.
Full text @ iScience