IMAGE

Fig. 1

ID
ZDB-IMAGE-240131-44
Source
Figures for Li et al., 2024
Image
Figure Caption

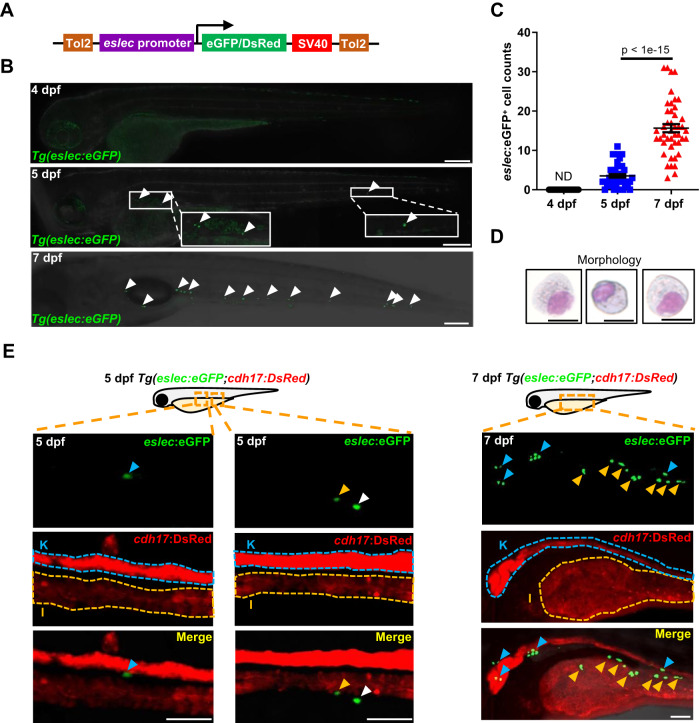
Fig. 1 The early spatial-temporal development and function of zebrafish eosinophils.

A Design of vector for generating Tg(eslec:eGFP) or Tg(eslec:DsRed) line. The eGFP or DsRed fluorescence is driven by the 4.3 kb eslec promoter and terminated by the SV40 terminator. Tol2 system was used to integrate these elements into the zebrafish genome. B Temporal development pattern of early eosinophils. No eosinophil could be found in 4 dpf larvae, while they start to emerge from 5 dpf onwards and increase at 7 dpf (white arrowhead, bar = 200 μm, white box showing enlarged view). C Quantification of B. The eosinophil populations were analyzed by Student’s t-test (two-sided, mean ± SEM, ND means not detectable). Sample size: 4 dpf, n = 30; 5 dpf, n = 45; 7 dpf, n = 45. Three independent experiments were conducted. D Morphologies of eslec+ cells. The eGFP+ cells were sorted from 7 dpf Tg(eslec:eGFP) larvae and applied to May-Giemsa staining (bar = 10 μm). Two independent experiments were conducted. E Spatial development pattern of early eosinophils. The kidney and intestine are respectively marked by “K” or “I” and surrounded by dotted lines, based on the cdh17 expression. The eosinophils located in the kidney, intestine, or possibly peritoneal fluid are respectively marked by blue, yellow, or white arrowhead (bar = 50 μm). Two independent experiments were conducted. Source data are provided as a Source Data file.

Acknowledgments
This image is the copyrighted work of the attributed author or publisher, and ZFIN has permission only to display this image to its users. Additional permissions should be obtained from the applicable author or publisher of the image. Full text @ Nat. Commun.