
Image
|
Figure Caption
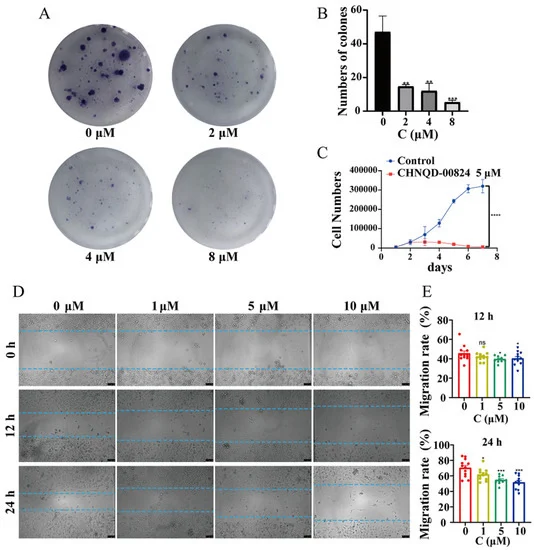
Fig. 5 CHNQD-00824 inhibited the proliferation and migration of BT549 cells. (A,B) CHNQD-00824 inhibited the colony formation of BT549 cells. The BT549 cells were treated with CHNQD-00824 for 13 d, then the clones were photographed and counted. (C) Growth curves of BT549 cells treated with CHNQD-00824 (5 μM) and DMSO. (D,E) The scratch assay of BT549 cells after treatment with CHNQD-00824 for 12 h and 24 h. Scale bar, 100 μm. The data shown are the mean ± SD (* p < 0.05, ** p < 0.01, *** p < 0.001, **** p < 0.0001 and ns, nonsignificant). n = 3 biological replicate samples.
Acknowledgments
This image is the copyrighted work of the attributed author or publisher, and
ZFIN has permission only to display this image to its users.
Additional permissions should be obtained from the applicable author or publisher of the image.
Full text @ Mar. Drugs