IMAGE

Figure 1

ID
ZDB-IMAGE-240129-229
Source
Figures for Wakai et al., 2024
Image
Figure Caption

Figure 1

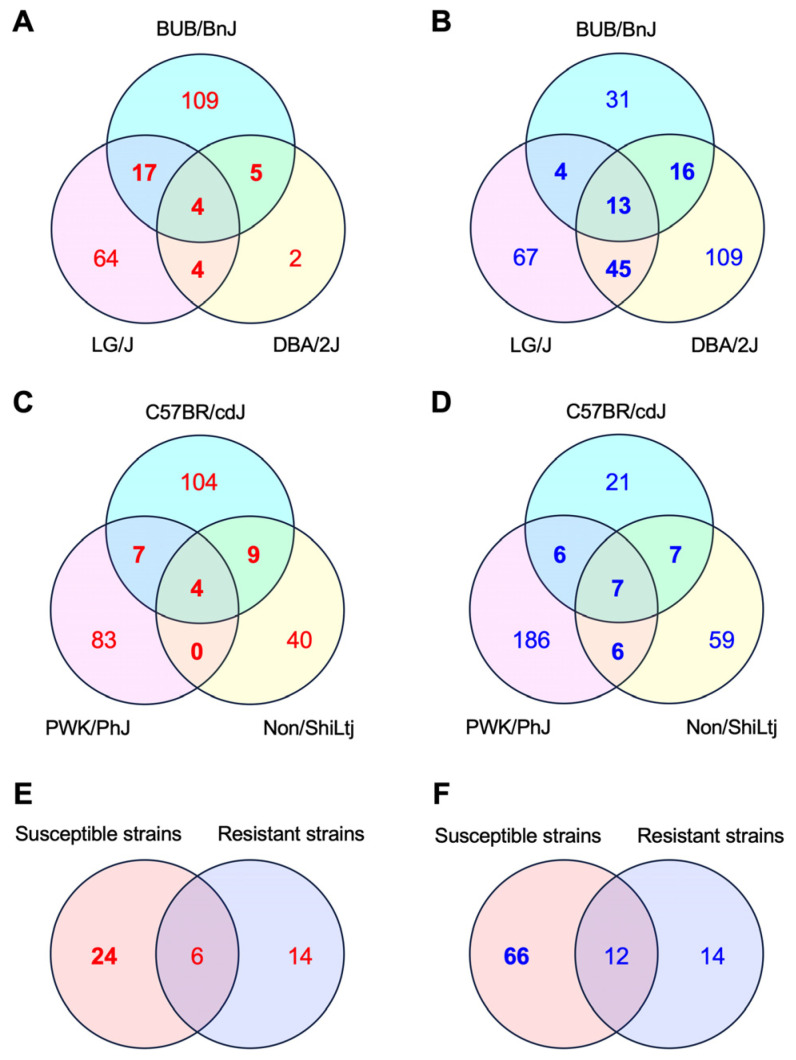
Comparative transcriptome analysis of the mouse livers that were susceptible or resistant to IILI. (AD) Venn diagrams of unique and shared differentially expressed genes in untreated vs. INH-treated mouse livers that were susceptible (A,B) or resistant (C,D) to IILI. Differentially expressed genes were identified using a false discovery rate threshold of 30%. (A,C) show genes that were upregulated, whereas (B,D) show genes that were downregulated by the INH treatment. (E,F) Venn diagrams of genes that were upregulated (E) or downregulated (F) in at least two strains among those susceptible or resistant to IILI.

Acknowledgments
This image is the copyrighted work of the attributed author or publisher, and ZFIN has permission only to display this image to its users. Additional permissions should be obtained from the applicable author or publisher of the image. Full text @ Pharmaceuticals (Basel)