IMAGE

Figure 7

ID
ZDB-IMAGE-240129-196
Source
Figures for Sun et al., 2024
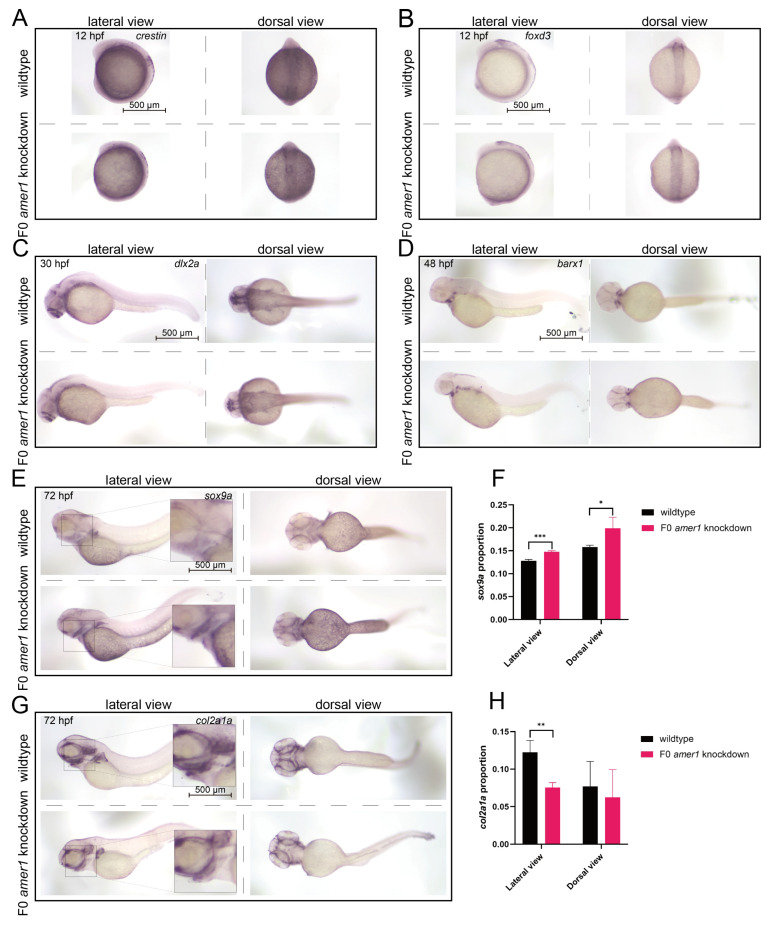
Image
Figure Caption

Figure 7

Expression of CNCC related markers in zebrafish embryos. In situ hybridization, showing the expression of (A) crestin and (B) foxd3 at 12 hpf, (C) dlx2a at 30 hpf, and (D) barx1 at 48 hpf in wildtype and F0 amer1 knockdown embryos. (AC) The levels of expression of crestin, foxd3, and dlx2a showed no apparent differences in wildtype and amer1 knockdown embryos. (D) The expression pattern of barx1 was smaller in amer1 knockdown than in wildtype embryos. (E,F) The expression of sox9a at 72 hpf was increased in amer1 knockdown than in wildtype embryos (for quantitative analysis, n = 3 each). (G,H) The expression of col2a1a at 72 hpf was decreased in amer1 knockdown than in wildtype embryos (for quantitative analysis, n = 3 each). * p < 0.05; ** p < 0.01; *** p < 0.001.

Acknowledgments
This image is the copyrighted work of the attributed author or publisher, and ZFIN has permission only to display this image to its users. Additional permissions should be obtained from the applicable author or publisher of the image. Full text @ Int. J. Mol. Sci.