
Fig 4
- ID
- ZDB-IMAGE-240127-11
- Genes
- Publication
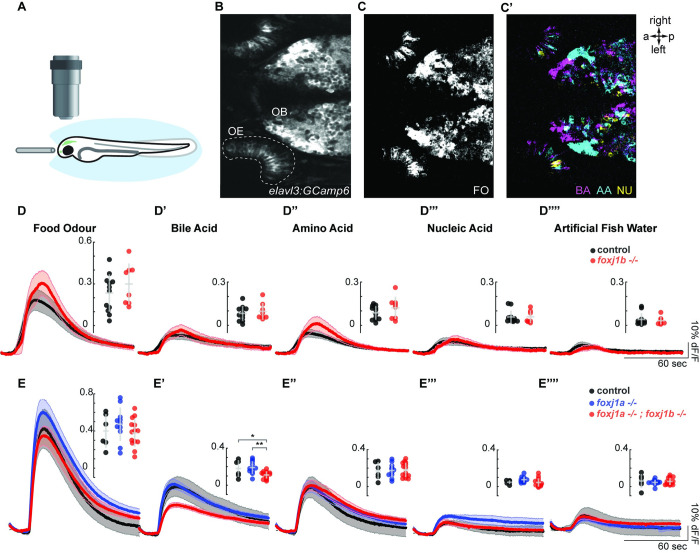
- Rayamajhi et al., 2024 - The forkhead transcription factor Foxj1 controls vertebrate olfactory cilia biogenesis and sensory neuron differentiation
- All Figures
- Figures for Rayamajhi et al., 2024
|
Fig 4
Olfactory response to bile acid is reduced in
(