
Image
|
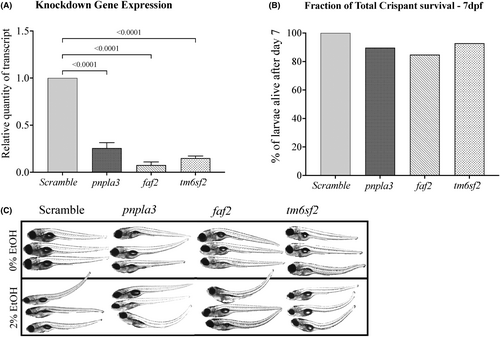
Figure Caption
Fig. 1 Survival and gene expression analysis in crispant zebrafish larvae. (A) gene expression (B) mortality of pnpla3, faf2 and tm6sf2. Each bar is with three repeated experiments (clutch, 15–20 larvae in each clutch). *Indicates p < .05 crispant-fold change compared to scramble control as 1 using non-parametric Mann–Whitney test. (C) Brightfield images from live Tg(lyzC:gfp)nz117 showing a range of developmental morphological abnormalities in pnpla3, faf2 and tm6sf2 crispants with 2% EtOH exposure
Acknowledgments
This image is the copyrighted work of the attributed author or publisher, and
ZFIN has permission only to display this image to its users.
Additional permissions should be obtained from the applicable author or publisher of the image.
Full text @ Liver Int.