
Image
|
Figure Caption
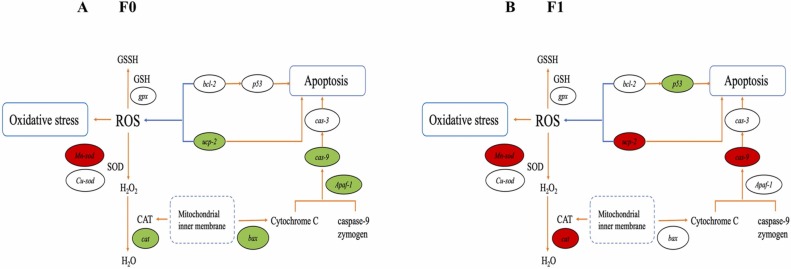
Fig. 8 Schematic diagram of the influence of dietary uranium exposure on the oxidative stress and apoptosis in F0 and F1 generation. (A) F0; (B) F1. Genes with green background indicate that the mRNA expression levels are significantly lower than those in control. Genes with red background indicate that the mRNA expression levels are significantly higher than those in control.
Acknowledgments
This image is the copyrighted work of the attributed author or publisher, and
ZFIN has permission only to display this image to its users.
Additional permissions should be obtained from the applicable author or publisher of the image.
Full text @ Ecotoxicol. Environ. Saf.