
Image
|
Figure Caption
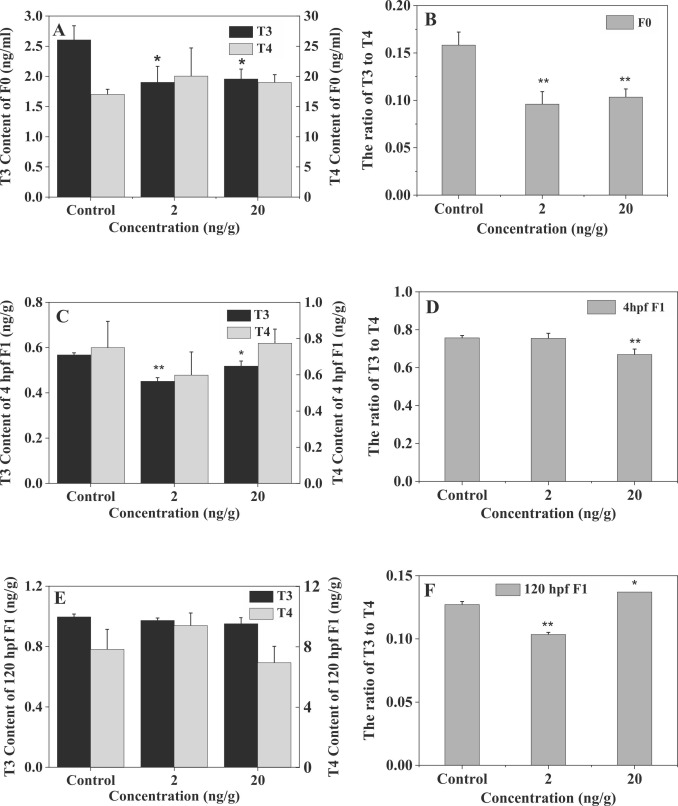
Fig. 3 Levels of T3 and T4 in F0 and F1 after parental zebrafish exposed to uranium. (A) T3 and T4 content of F0 (B) T3/T4 ratio of F0 (C) T3 and T4 content of F1 at 4 hpf (D) T3/T4 ratio of F1 at 4 hpf (E) T3 and T4 content of F1 at 120 hpf (F) T3/T4 ratio of 1 F1 at 20 hpf. * indicates significantly different at p < 0.05 level.
Acknowledgments
This image is the copyrighted work of the attributed author or publisher, and
ZFIN has permission only to display this image to its users.
Additional permissions should be obtained from the applicable author or publisher of the image.
Full text @ Ecotoxicol. Environ. Saf.