
Fig. 2
- ID
- ZDB-IMAGE-240124-31
- Publication
- Rodríguez-Ruiz et al., 2023 - ZAKα/P38 kinase signaling pathway regulates hematopoiesis by activating the NLRP1 inflammasome
- All Figures
- Figures for Rodríguez-Ruiz et al., 2023
|
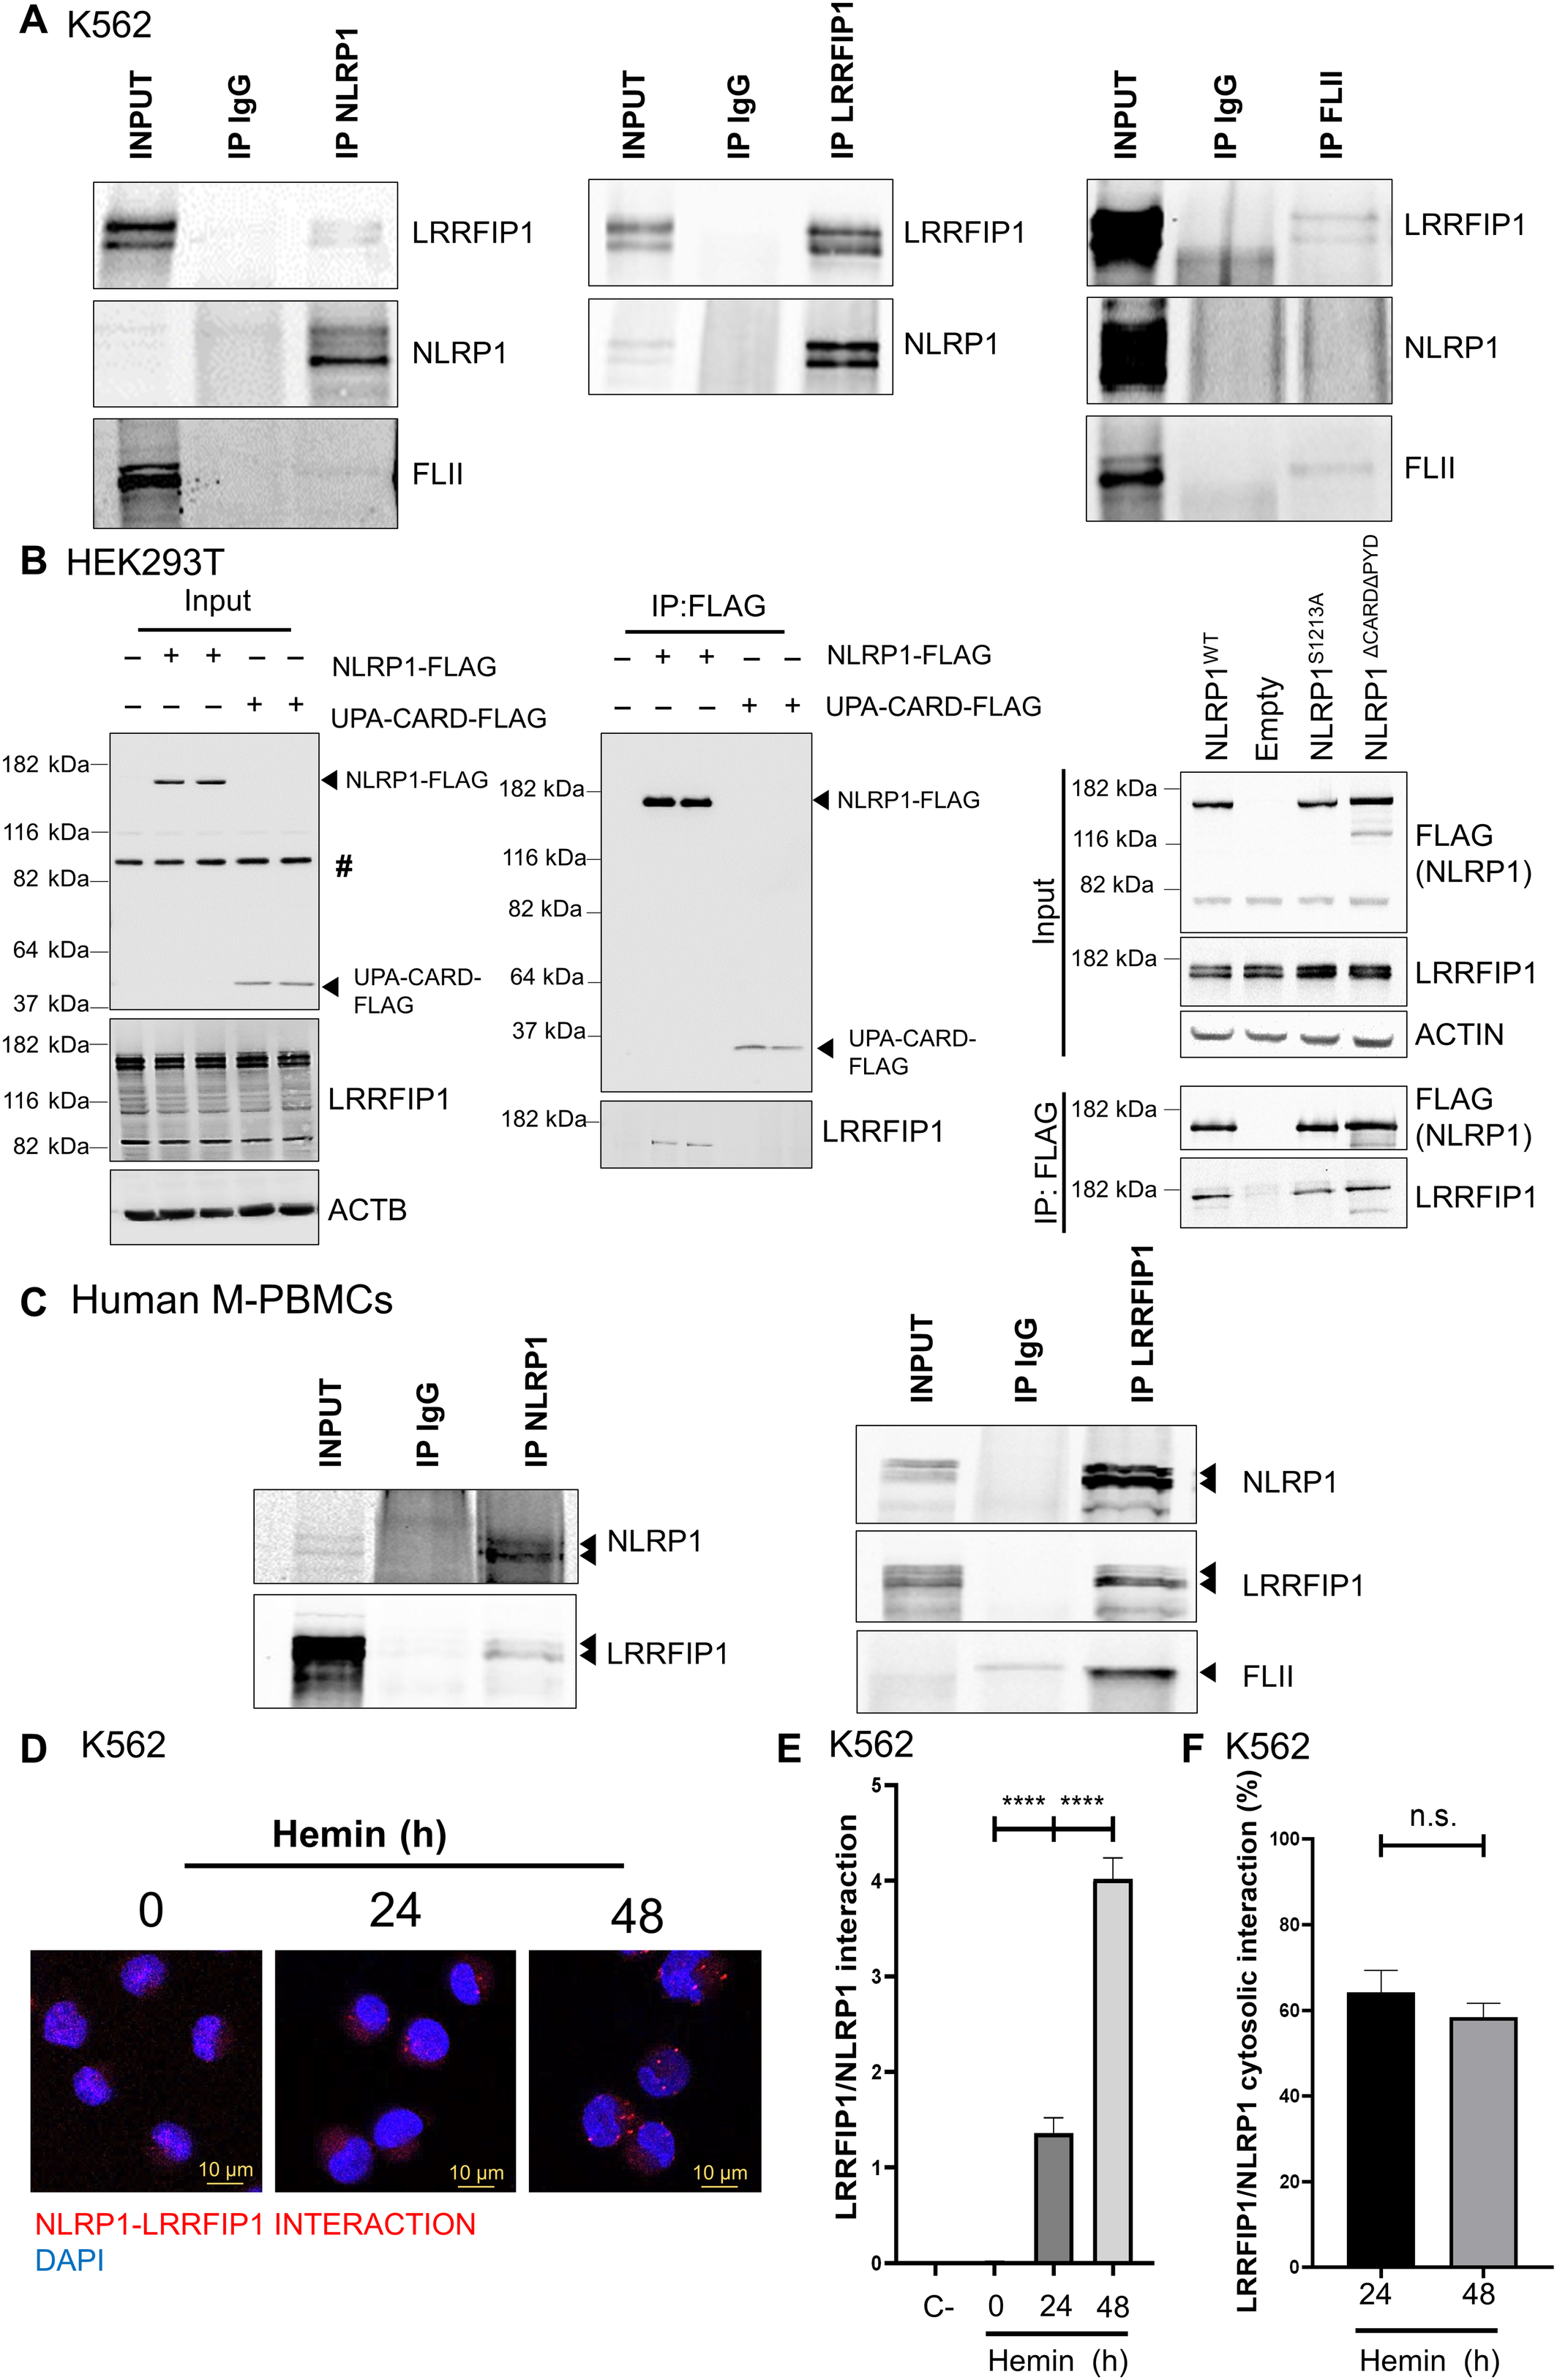
Fig. 2 LRRFIP1 and FLII interact with human NLRP1 inflammasome A–F Interaction of NLRP1 with LRRFIP1 and FLII in K562 cells (A, D–F), HEK293 cells (B) and M‐PBMCs (C) assayed by co‐immunoprecipitation assays and PLA (D–F). Endogenous proteins (A, C–F) and transfected FLAG‐tagged full‐length NLRP1, NLRP1ΔCARDΔPYD, NLRP1_S1213A and UPA‐CARD (B) were analyzed. The number of interactions per cell (E) and the percentage of cytosolic interactions (F) are shown (n = 100 cells). Data are shown as the means ± SEM. P values were calculated using one‐way ANOVA and Tukey's multiple range test. n.s., non‐significant; ****P < 0.0001. #, non‐specific band.