
Image
|
Figure Caption
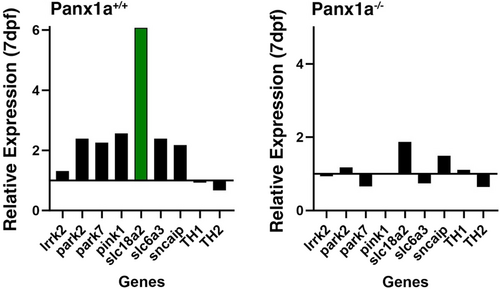
Fig. 5 Differential expression of genes of the dopaminergic pathway in the 6-OHDA model at 7dpf. The bar charts show the relative expression ratios of nine genes quantified by RT-qPCR. We compared the expression of 6-OHDA-treated larvae to untreated siblings for both genotypes. The green bar represents a statistically significant upregulation (p < .05). Statistical test: Relative Expression Software Tool (REST-2009) (Pfaffl, 2002). Number of experimental replicates (n = 3).
Acknowledgments
This image is the copyrighted work of the attributed author or publisher, and
ZFIN has permission only to display this image to its users.
Additional permissions should be obtained from the applicable author or publisher of the image.
Full text @ J. Neurosci. Res.