
|
Figure 4
RAs sense an increase in norepinephrine during synchronous Ca2+ events
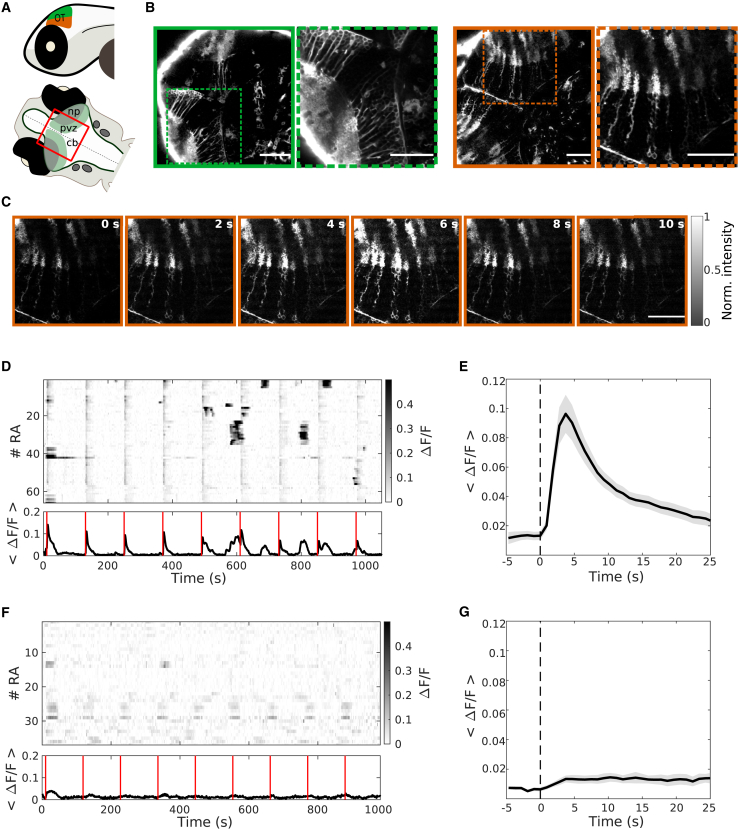
(A) Scheme of the zebrafish head showing the imaged areas. Top: lateral view, OT dorsal region (green), OT ventral region (orange). Bottom: dorsal view, imaged area (red square). Shaded green: OT. np, tectal neuropil; pvz, periventricular zone; cb, cerebellum; dashed line, midline.
(B) Optical section of the OT, in a larva expressing the NE sensor (GRABNE1m) under an RA promoter (her4.1). Green: left, OT dorsal layers; right, zoom of the dashed square area. Orange: left, OT ventral layers; right, zoom of the dashed square area.
(C) Temporal series of an optical section of the OT of a zebrafish larva expressing GRABNE1m in RAs, imaged using a two-photon microscope (orange dashed square in [B]). Note the changes in fluorescence of the RAs. Time zero indicates a mild electric stimulation to induce an escape behavior. Gray scale bar: normalized florescence.
(D) Top: raster plot of RAs’ NE activity in the ventral OT. Bottom: mean NE activity across RAs. Gray scale bar: ΔF/F. Red line: time of the mild electric stimulation.
(E) The mean NE activity of RAs in the ventral OT. Dashed line: mild electric stimulus.
(F and G) As in (D) and (E), for the dorsal OT. The mean amplitude of the NE transients in the ventral OT was significantly larger than those in the dorsal OT (mean amplitude: dorsal OT, 0.03 ± 0.004; ventral OT, 0.11 ± 0.01; p > 0.001; two-sided rank-sum test, n = 7 dorsal OT, n = 11 ventral OT). Scale bars: 50 μm.
See also