
|
Figure 3
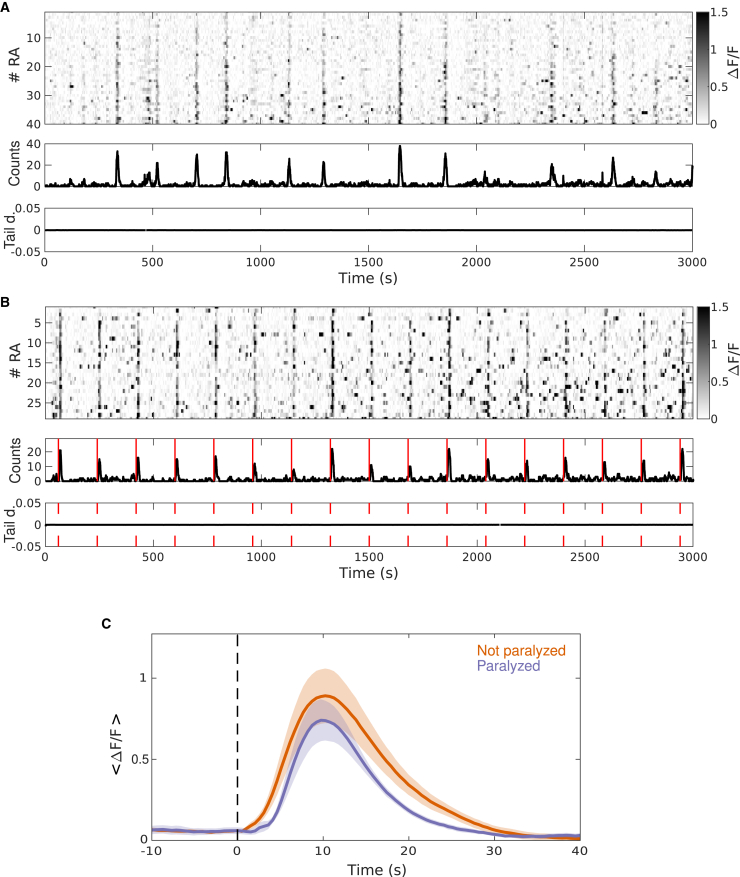
Muscle proprioception does not play a role in RAs Ca2+ synchronization
(A) Top: raster plot of RA spontaneous Ca2+ activity of paralyzed larvae. Middle: number of Ca2+ events across RAs. Bottom: tail deflection (L0/R). Gray scale bar: ΔF/F.
(B) As in (A), but mild electric stimuli were presented every 180 s to induce escape behaviors. Red line: time of the mild electric stimulus.
(C) The mean Ca2+ activity of RAs associated with mild electric stimuli (time zero) in paralyzed (magenta) and non-paralyzed (orange) larvae. Mean amplitude of the two distributions were not significantly different (non-paralyzed, 0.98 ± 0.16; paralyzed, 0.83 ± 0.15, ΔF/F; p = 0.85; two-sided rank-sum test, n = 11 control, n = 5 paralyzed).