
|
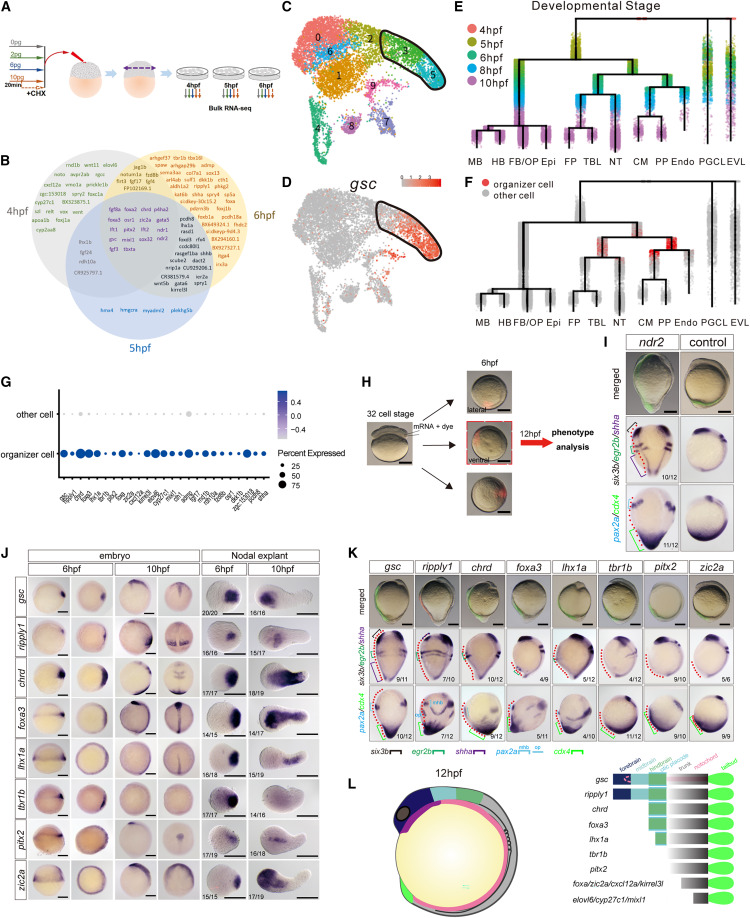
Fig. 6 Identification of Nodal downstream genes with head organizer functions (A) Schematic representation of the experimental workflow of bulk RNA-seq in the explants. RNA-seq was performed for biological triplicates. (B) Venn diagrams show the 105 identified overlapping Nodal targets at three time points. (C and D) Selection of organizer cells from single-cell transcriptome of the 6 hpf Nodal explants. UMAP plot of Nodal explants at 6 hpf; cells are colored according to cell clusters (C) and expression of gsc (D), the first identified dorsal organizer gene47 highly expressed in clusters 3 and 5 (C, black frame). (E) Dendrogram layout of URD differentiation tree of Nodal explants from 4 to 10 hpf. Cells are colored according to developmental stages. (F) Organizer cells (red dots) were shown on the URD tree of Nodal explants. (G) Dot plot visualization of 25 Nodal targets that were highly expressed in organizer cells. Dot size indicates the percentage of cells within a cell group; the color indicates the average expression level. (H) Ventral overexpression of candidate genes. Fluorescein indicated the clones of the injected blastomere at the 32-cell stage. (I) Upper: merged images of live embryos injected with ndr2 mRNA or dye only (control). Middle: ISH of six3b (forebrain), egr2b (hindbrain), and shha (notochord) showed indicated structures of the primary and induced secondary axis at 12 hpf. Bottom: ISH of pax2a (midbrain-hindbrain boundary [mhb]), otic placode (op), and cdx4 (posterior mesoderm and posterior neural ectoderm) showed indicated structures of the primary and induced secondary axes at 12 hpf. Red dashed lines indicate induced secondary axes. (J) WISH of selected genes from 25 Nodal targets (in G) in Nodal explants and embryos at 6 and 10 hpf. (K) ISH of indicated genes showed the axis induction capabilities of Nodal targets (as shown in I). (L) Illustration of axis induction capabilities of 14 Nodal targets. The statistics of observed/total sampled Nodal explants (J) and embryos with secondary axis (I and K) were shown in bottom left (J) or bottom right (I and K) of the panels (biological replicates). Each secondary axis induction experiment was performed for at least 5 independent replicates, and each ISH experiment was performed for at least 3 independent replicates (technical replicates). Scale bars: 200 μm (I–K). CHX, cycloheximide; CM, cephalic mesoderm; Endo, endoderm; Epi, epidermis; EVL, enveloping layer; FB/OP, forebrain/optical; FP, floor plate; HB, hindbrain; MB, midbrain; NT, notochord; PGCL, primordial germ cell-like; PP, prechordal plate; TBL, tailbud-like. See also Figures S5–S7, Table S1, and Data S1.