
Figure S10.
- ID
- ZDB-IMAGE-240111-37
- Publication
- Heins-Marroquin et al., 2024 - CLN3 deficiency leads to neurological and metabolic perturbations during early development
- All Figures
- Figures for Heins-Marroquin et al., 2024
|
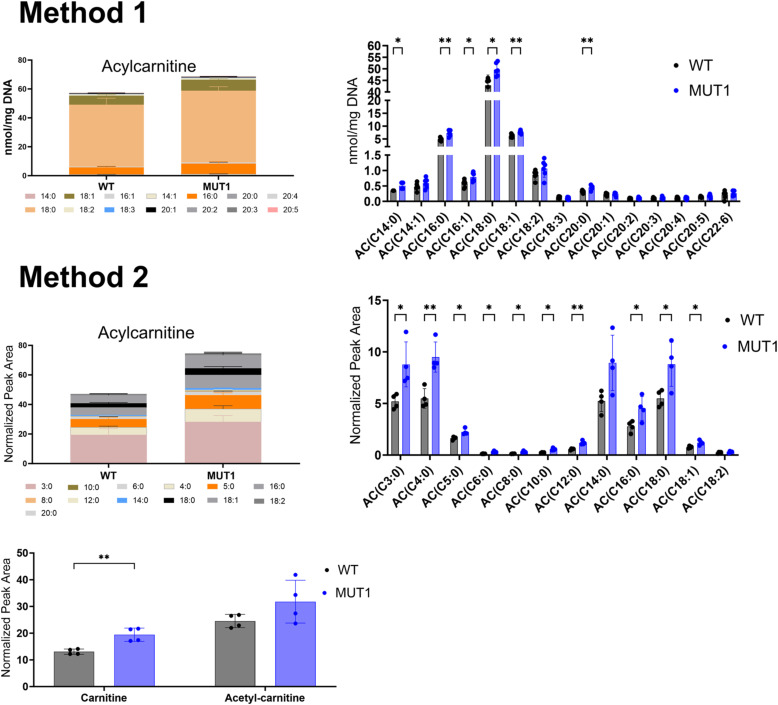
Figure S10. Acylcarnitine measurements using two independent targeted LC-MS methods.
In the upper part, ACs were extracted and measured by Lipometrix (Method 1). In the lower part, carnitine, acetylcarnitine, and ACs were extracted and measured at the LCSB metabolomics facility (Method 2). Each dot represents a pool of 40 larvae, and in total, six (Method 1) and four (Method 2) biological replicates were measured. In both targeted methods, AC showed slightly increased levels in MUT1 compared with WT larvae. Statistically significant differences between the zebrafish lines were determined using an unpaired parametric multiple Welch’s