
Fig 8
- ID
- ZDB-IMAGE-240105-71
- Publication
- Rothschild et al., 2023 - Constitutively active CaMKII Drives B lineage acute lymphoblastic leukemia/lymphoma in tp53 mutant zebrafish
- All Figures
- Figures for Rothschild et al., 2023
|
Fig 8
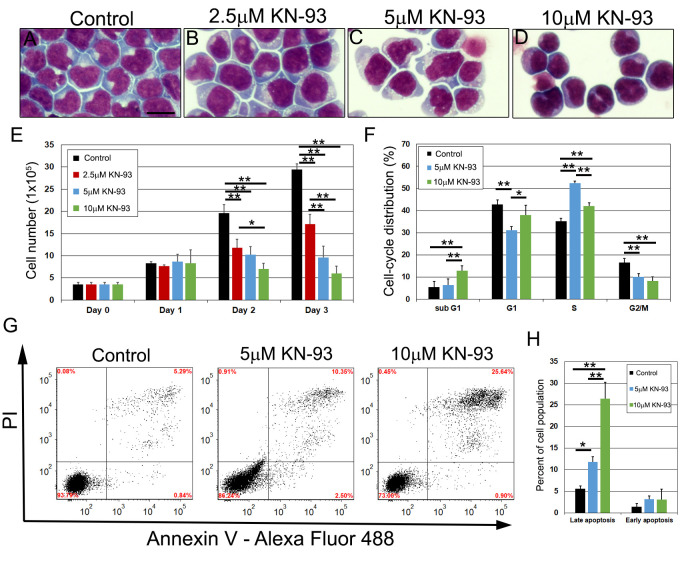
HEMA3 stained NALM6 cells treated with 2.5μM, 5μM, and 10μM KN-93 at 48h (A-D). NALM6 growth curves were assessed at 24-hour intervals until 72h after KN-93 treatment. (E, n = 3). Cell cycle distribution was assessed after PI staining in control, 5μM, and 10μM KN-93 treated NALM6 cells at 48h (F, n = 5). NALM6 cells were stained with Annexin V and PI after KN-93 treatment and analyzed using flow cytometry at 48h. The lower left quadrant are cells that are negative for Annexin V and PI, the upper left quadrant is PI positive only indicative of necrosis, the upper right quadrant identifies cells that are positive for both Annexin V and PI indicating late apoptosis, and the bottom right quadrant shows cells that are Annexin V positive, which indicates early stages of apoptosis (G). The bar graph shows the percent of cells that are in early and late stage of apoptosis from four experiments (H). P values were calculated using one-way ANOVA followed by Tukey HSD. * p<0.05 and ** P<0.01. Scale bar: 20 μm in A.