IMAGE

Fig 3

ID
ZDB-IMAGE-240105-66
Source
Figures for Rothschild et al., 2023
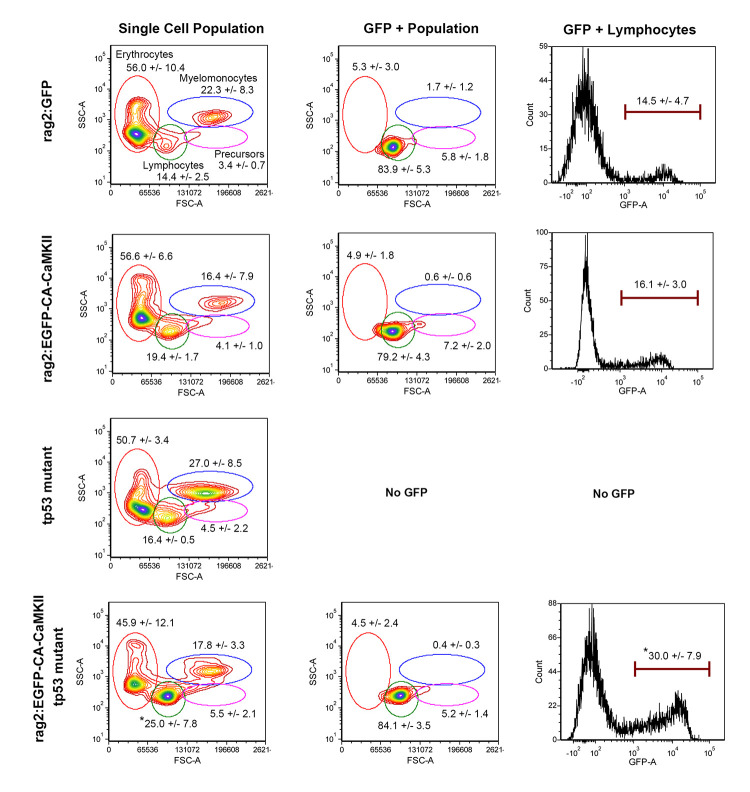
Image
Figure Caption

Fig 3 The lymphocyte population is expanded in the kidney marrow of rag2:EGFP-CA-CaMKII; tp53 mutant fish.

FACS analysis of the kidney of six-month old rag2:GFP (n = 4), rag2:EGFP-CA-CaMKII transgenic (n = 5), tp53 mutant (n = 2), and rag2:EGFP-CA-CaMKII; tp53 mutant fish (n = 5) without overt illness. Gated populations: erythrocytes (red), lymphocytes (green), precursors (pink), and myelomonocytes (blue). Populations of cells within each gate are described as a percentage of total live cells. The GFP positive population for each sample is predominantly found in the lymphocyte gate, as expected. The percentages of GFP positive cells in the lymphocyte gate are represented in the histograms. P values were calculated using one-way ANOVA followed by Tukey HSD. * p<0.05.

Acknowledgments
This image is the copyrighted work of the attributed author or publisher, and ZFIN has permission only to display this image to its users. Additional permissions should be obtained from the applicable author or publisher of the image. Full text @ PLoS Genet.