
|
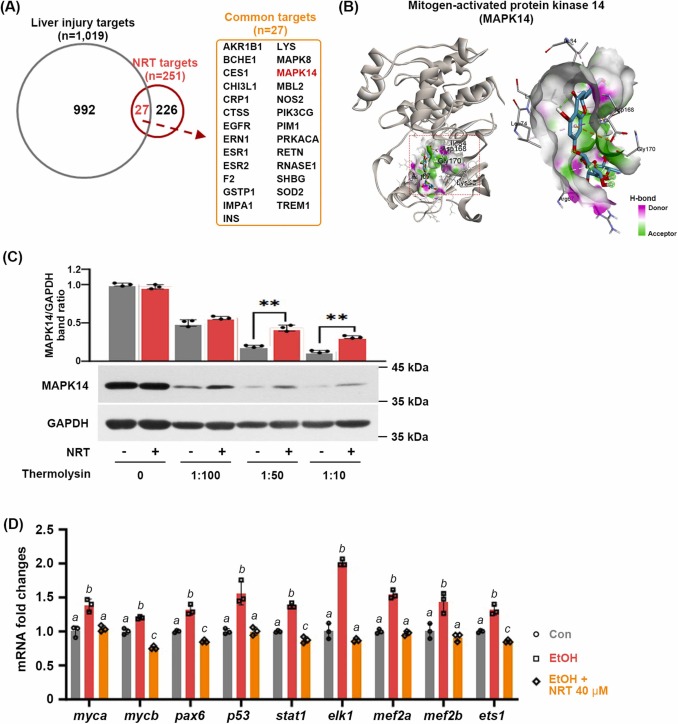
Fig. 7 Network pharmacology analysis and target evaluation of NRT for alcohol-induced liver injury. (A) Venn diagram of the common target of NRT and liver injury. (B) 3D-dimensional view of the best target-ligand conformation of interaction between NRT and MAPK14. The interaction was analyzed using Discovery Studio Visualizer and represented H-bonds interaction. (C) DARTS assay using NRT (100 μM) showed the interaction between NRT and MAPK14. HepG2 cell lysates were incubated with NRT or vehicle (DMSO) for 30 min, followed by digestion with different dilutions of thermolysin (1:10, 1:50, and 1:100) for 10 min. Western blot analysis used antibodies against MAPK14 or GAPDH. MAPK14 level was normalized to GAPDH and fold change relative to control was calculated by using the MAPK14/GAPDH ratio. **, p < 0.01 (D) Validation of transcription factor genes within the MAPK14 signaling pathway by NRT. The data are presented as the mean ± SD; a,b,c mean values with different superscript letters are significantly different among the groups (p < 0.05).