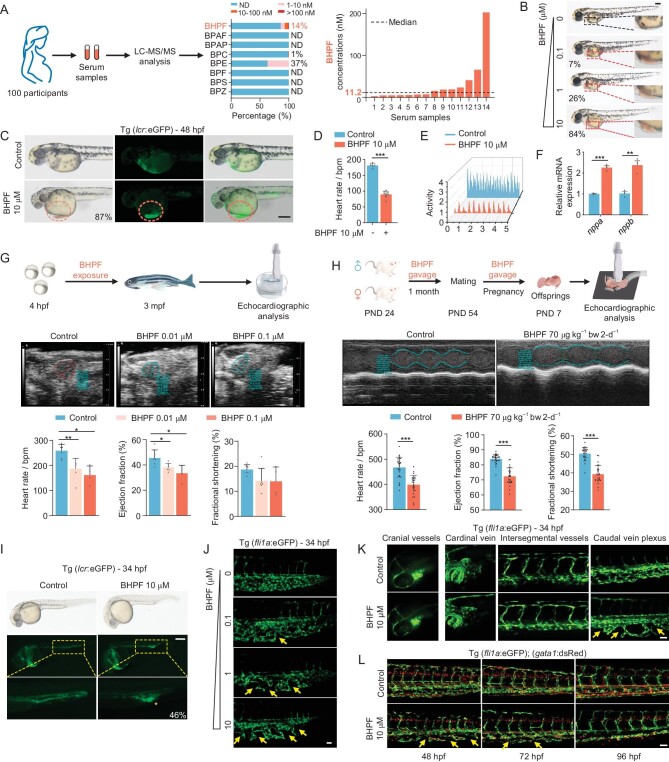
IMAGE

Figure 1.

ID
ZDB-IMAGE-231228-137
Source
Figures for Lin et al., 2023
Image
Figure Caption

Figure 1.

BHPF is detectable in pregnant people and displays cardiac and vascular toxicity in zebrafish and mice. A, Detection rates and concentration ranges of eight BPA substitutes in serum samples from 100 pregnant participants (left panel). Concentration of BHPF in serum samples (right panel). ND refers to not detected. B, Morphological changes of zebrafish (48 hpf) with concentration gradient exposure (0.1–10 μM) to BHPF. The pericardial condensation is indicated by red dashed boxes with percentage; n = 25–28 per group. C, Bright field and fluorescence microscopy of BHPF-exposed Tg(lcr: eGFP) zebrafish. The red dashed circles indicate pericardial condensation with percentage; n = 15–20 per group. D and E, Effects of BHPF (10 μM) on heart rate (D) and heart activity (E) of embryos. Heart rate as beats per minute (bpm) and heart activity recordings (electrocardiogram) were analyzed by DanioScope; n = 5–9 per group. F, Effects of BHPF (10 μM) exposure on mRNA expression of nppa and nppb as detected by RT-qPCR in whole embryos. G, Schematic diagram of echocardiographic analysis for BHPF-exposed zebrafish (top panel). Representative echocardiograms (middle panel), summary of heart rate (as bpm), cardiac ejection fraction (EF) and fractional shortening (FS) in control and BHPF exposed (0.01–0.1 μM for 3 months) zebrafish (bottom panel); n = 4–7 per group. H, Diagram showing the BHPF exposure and echocardiography analysis in mice (top panel). Representative echocardiograms (middle panel), summary of heart rate (as bpm), cardiac ejection fraction (EF) and fractional shortening (FS) in the offspring of control and BHPF-exposed mice (7.3 nM BHPF in the serum of pregnant mice) (bottom panel); n = 26–29 per group. I, Effects of BHPF (10 μM) on distribution of erythroid in zebrafish (34 hpf). The yellow dashed boxes and asterisk indicate blood accumulation with percentage; n = 28–30 per group. J, Confocal observation of CVP in Tg(fli1a: eGFP) zebrafish (34 hpf) with concentration gradient exposure (0.1–10 μM) to BHPF. The yellow arrows indicate CVP defects. K, Effects of BHPF (10 μM) on vein development in different regions of zebrafish (34 hpf). The yellow arrows indicate CVP defects. L, Effects of BHPF (10 μM) on vein development in different developmental stages of zebrafish (48–96 hpf). The yellow arrows indicate CVP defects. Zebrafish embryos were treated with BHPF from 4 hpf to the indicated time. Scale bar, 300 μm (B, C, I) or 20 μm (J–L). Data are mean ± s.d. Student's t test, *represents P < 0.05, **represents P < 0.01, *** represents P < 0.001.

Acknowledgments
This image is the copyrighted work of the attributed author or publisher, and ZFIN has permission only to display this image to its users. Additional permissions should be obtained from the applicable author or publisher of the image. Full text @ Natl Sci Rev