
|
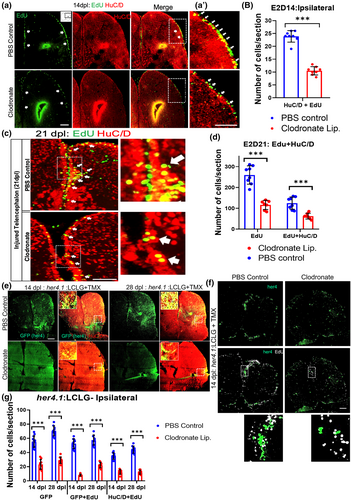
Fig. 3 Microglial suppression impairs injury-induced adult neurogenesis. (a) Confocal images of EdU staining, HuC/D immunolabeling and double labeling for EdU and HuC/D in the injured hemi-telencephala at 14 dpl after EdU administration at 2 dpl from control (top row) and clodronate injected (bottom row) brains. The arrows denote EdU+ cells in VZ regions. (a′) Higher magnification images of the boxed regions in (a). Note more double-labeled cells (arrows) are present in the control than the clodronate-treated fish (bottom). The strong signal at the injury site is non-specific labeling of damaged brain. (b) Quantification of EdU and HuC/D double labeling at 14 dpl. ***p < .0001 by t-test. (c) Confocal images of EdU and HuC/D double labeling in telencephala at 21 dpl (EdU was given at 2 dpl). Right panels show higher magnification views of the boxed regions, and the arrows indicate double labeled cells. (d) Quantification of EdU+ cells (green) and cells co-labeled for EdU and HuC/D (magenta outline) in injured hemi-telencephala at 21 dpl (EdU was given at 2 dpl) shows proportionally fewer cells in the clodronate-treated group. **p < .001 for EdU only; and ***p < .0001 for double-labeled cells. (e) Confocal images of her4.1(GFP) and HuC/D labeling of telencephala at 14 dpl (left 4 panels) or 28 dpl (right 4 panels) from fish treated with control (top row) or clodronate (bottom row) liposomes show decreased GFP labeling and double-labeled cells in the clodronate group. Insets in double-labeled panels show higher magnification views of the boxed areas. (f) Confocal images of telencephala show decreased labeling for her4.1-GFP and EdU in the clodronate-treated fish at 14 dpl. The bottom panels shows a higher magnification views of double-labeled cells. 4-OH-TMX was given at the time of lesioning for both (f and g), and EdU was administered at 2 dpl. (g) Quantification of her4.1-GFP, her4.1-GFP/EdU co-labeling and her4.1-GFP/HuC/D co-labeling at 14 and 28 dpl. ***p < .0001. Scale bars = 100 μm for all image panels and the error bars indicate SEM.