Image
Figure Caption

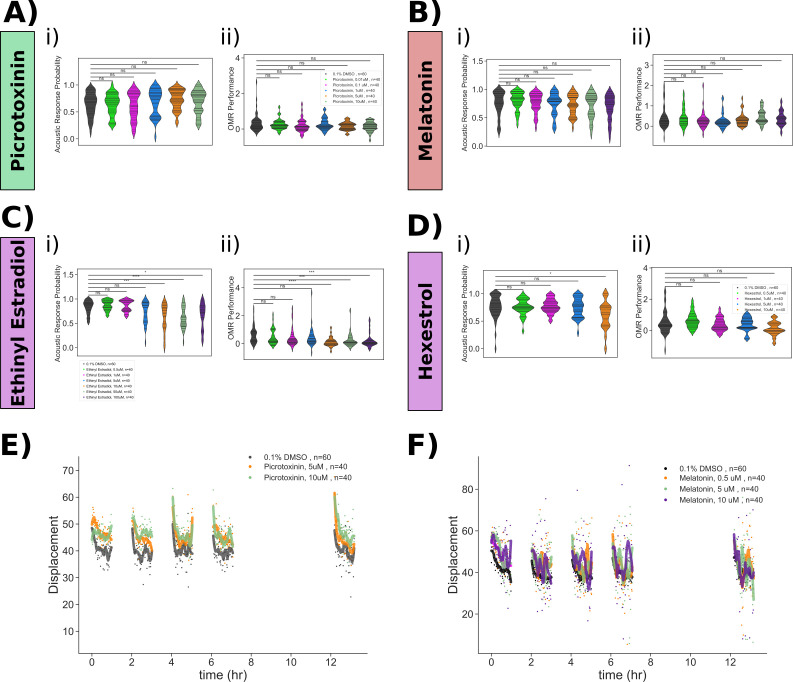
Figure 5—figure supplement 1. Pharmacological manipulation of control behaviours and response displacement during habituation.

Dose–response studies for (A) picrotoxinin, (B) melatonin, (C) ethinyl estradiol, and (D) hexestrol. Displayed for each treatment are (i) violin plots for the dose–response data, showing the probability of response to 30 acoustic tap stimuli. Horizontal lines = individual fish. (ii) Violin plots for the dose–response data OMR performance. Horizontal lines = individual fish. Statistical tests: Mann–Whitney with Bonferroni correction, ns, not significant; p=1×10⁴;=1×10³;=1×10²;=0.05. (E) Treatment with picrotoxinin inhibits the decreases in movement displacement during habituation training. (F) Treatment with melatonin inhibits the decreases in movement displacement during habituation training. Each dot is the mean response of the population to one flash. Lines are smoothed in time with a Savitzky–Golay filter (window = 15 stimuli, order = 2).

Acknowledgments
This image is the copyrighted work of the attributed author or publisher, and ZFIN has permission only to display this image to its users. Additional permissions should be obtained from the applicable author or publisher of the image. Full text @ Elife